
.png
)


Translations
| Code | Language | Translator | Run | |
|---|---|---|---|---|
 |
||||
Credits


This email address is being protected from spambots. You need JavaScript enabled to view it.; Francisco Esquembre; Flix J. Garca Clemente; based on ideas by Evan Yeo
- Main Theme: The title directly indicates that this source likely explains and possibly provides an interactive simulation of the Production Possibilities Curve (PPC). The PPC is a fundamental concept in economics that illustrates the trade-offs an economy faces when allocating its scarce resources between the production of different goods or services. It shows the maximum possible output combinations given the available resources and technology.
- Key Ideas (Inferred): While the excerpt doesn't provide the content explaining the PPC, we can infer that the resource likely covers:
- The definition and purpose of the Production Possibilities Curve.
- Concepts such as scarcity, trade-offs, opportunity cost, and efficiency, as they are visually represented by the PPC.
- The potential for the PPC to shift outwards due to economic growth (e.g., technological advancements or increased resources).
- The difference between points on, inside, and outside the PPC, representing efficiency, underutilization, and infeasibility, respectively.
- Format: The mention of "Compiled with EJS 6.0_beta (180814)" suggests that this is likely an interactive simulation or visualization built using the Easy JavaScript Simulations (EJS) framework.
Source 2: "Taxes on Producers Economics JavaScript HTML5 Applet Simulation Model - Open Educational Resources / Open Source Physics @ Singapore | Open Educational Resources / Open Source Physics @ Singapore"
- Title and Source: The title clearly identifies this source as an "Economics JavaScript HTML5 Applet Simulation Model" focusing on the impact of "Taxes on Producers." It is provided by "Open Educational Resources / Open Source Physics @ Singapore."
- Authorship and Credits: Similar to the first source, credits are given to this email address is being protected from spambots. You need JavaScript enabled to view it., Francisco Esquembre, Flix J. Garca Clemente, and based on ideas by Evan Yeo. This suggests a connection or collaboration between the creators of both resources.
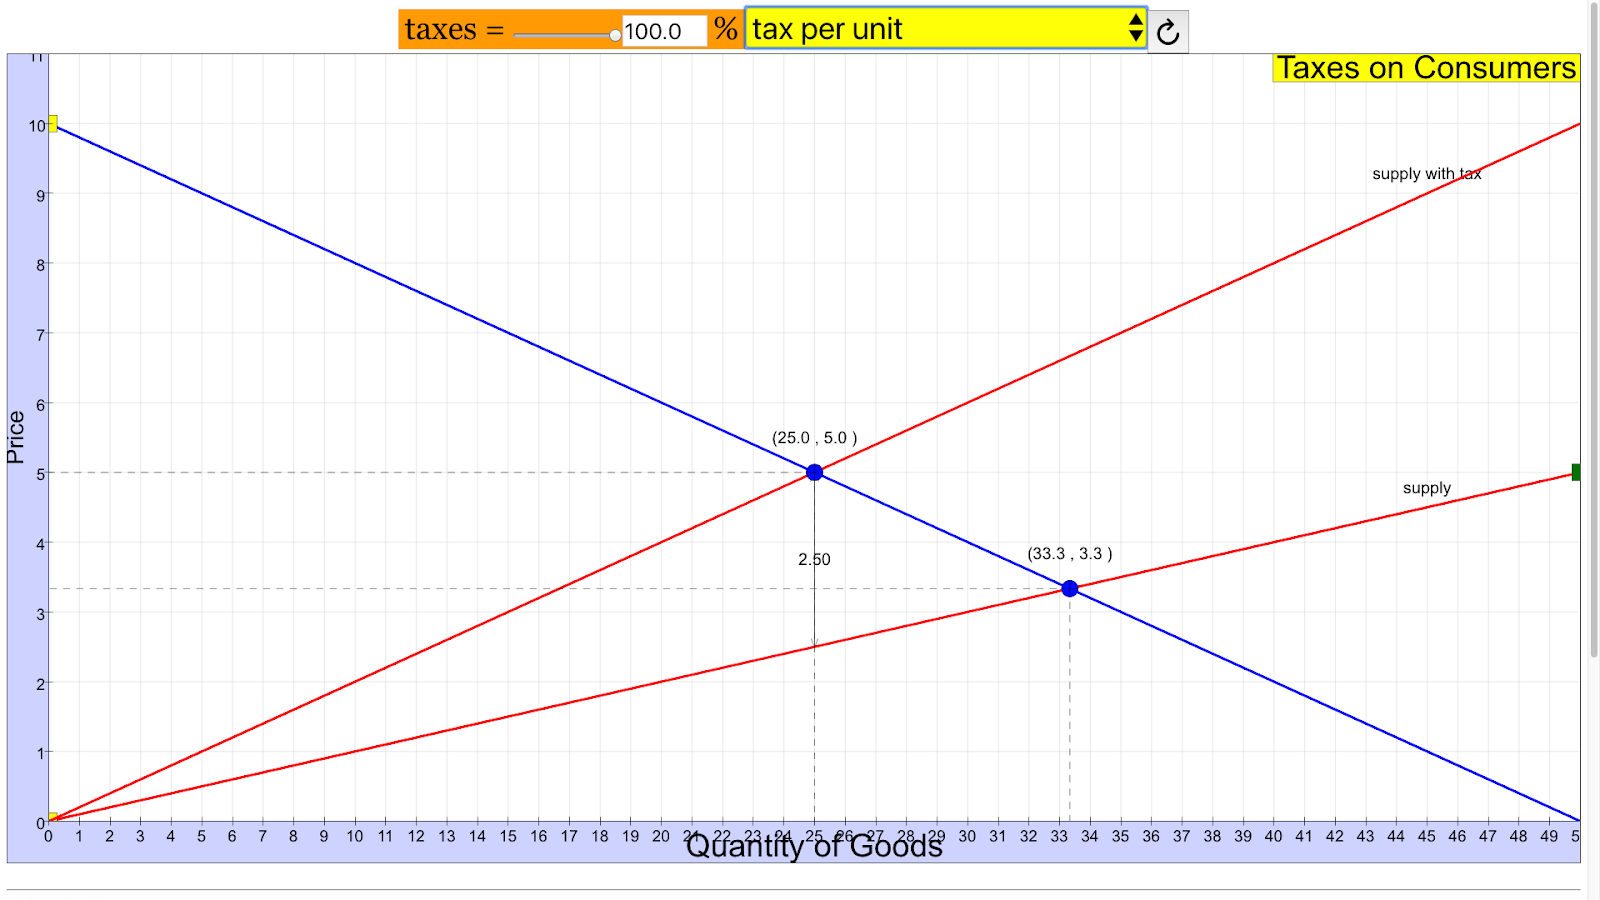
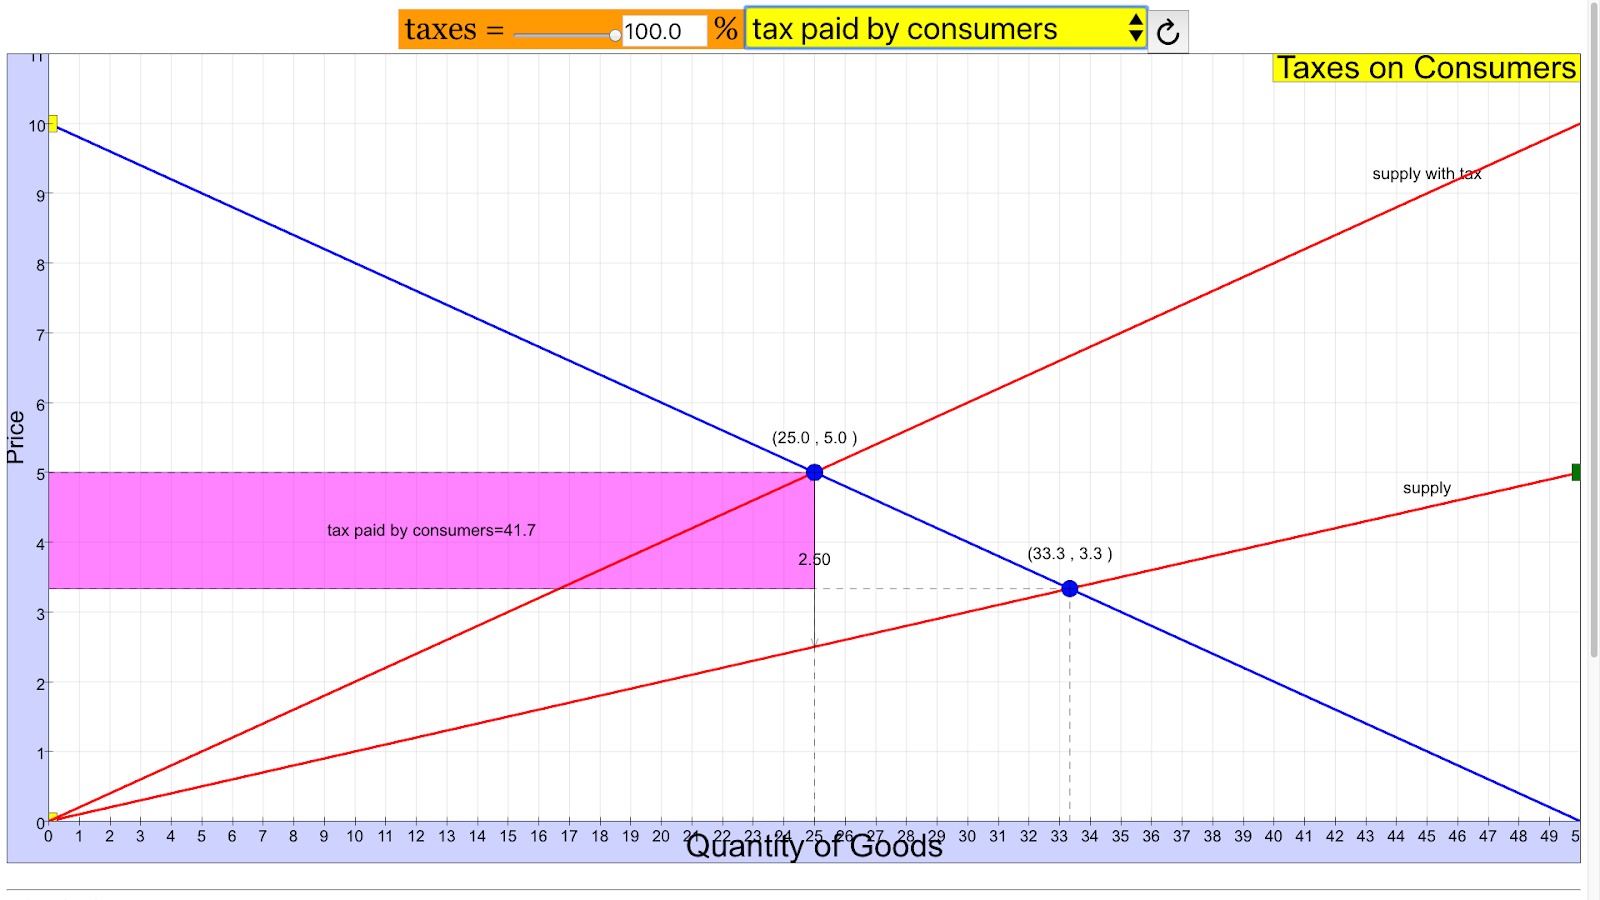
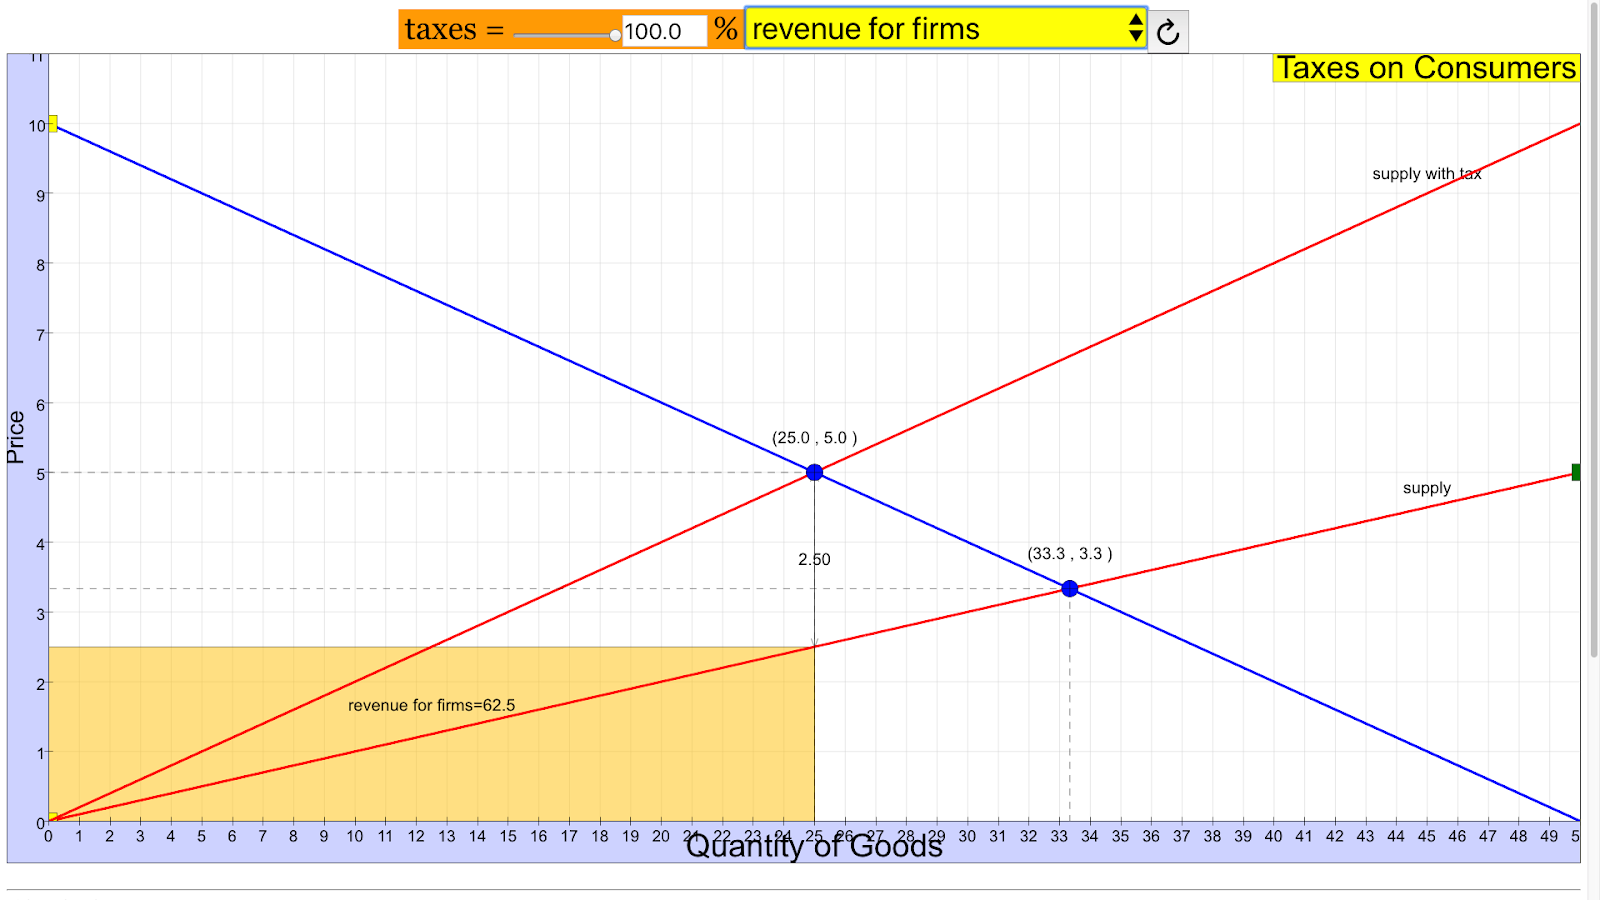
- Main Theme: The central theme of this resource is to demonstrate and allow users to explore the economic effects of taxes imposed on producers. This involves understanding how such taxes influence supply, demand, prices, and ultimately, the distribution of the tax burden between consumers and producers.
- Key Ideas and Learning Goals: The excerpt explicitly lists several "Sample Learning Goals" (though the actual text of these goals is not provided) and identifies specific variables and concepts that the simulation likely allows users to manipulate and observe. These include:
- tax per unit: Users can likely adjust the amount of tax levied on each unit of production.
- tax revenue: The simulation will likely display the total revenue generated by the tax.
- tax paid by consumers: The simulation will likely show the portion of the tax burden passed on to consumers through higher prices.
- tax paid by producers: The simulation will likely show the portion of the tax burden absorbed by producers through lower net revenue.
- expenditures: This likely refers to consumer spending.
- revenue for firms (producers): The simulation will likely show the total revenue earned by producers before and after the tax.
- Format: The description as a "JavaScript HTML5 Applet Simulation Model" and the provided embed code (<iframe width="100%" height="100%" src="https://iwant2study.org/lookangejss/economics/ejss_model_TaxesonProducers/TaxesonProducers_Simulation.xhtml " frameborder="0"></iframe>) confirms that this is an interactive web-based simulation.
- Additional Information:The inclusion of "Translations" suggests the model may be available in multiple languages.
- The "For Teachers" section with direct links to the simulation indicates its intended use in educational settings.
- The "Version" link points to a blog post providing further context or information about the applet.
- The extensive list under the accordion menu seems to be a collection of other interactive simulations and resources available from the same platform, covering a wide range of topics in physics, mathematics, and other sciences. This highlights the broader context of open educational resources being developed and shared.
- The licensing information at the end ("Contents are licensed Creative Commons Attribution-Share Alike 4.0 Singapore License") reinforces the commitment to open education and sharing of these resources.
Connections and Overall Theme:
Both sources originate from the same or closely related groups (This email address is being protected from spambots. You need JavaScript enabled to view it., Francisco Esquembre, Félix J. García Clemente, based on Evan Yeo) and are presented under the umbrella of open educational resources, particularly those developed at Singapore. They both utilize interactive JavaScript HTML5 applet simulations as a method for teaching and learning fundamental economic concepts. The "Production Possibilities Curve" likely illustrates basic economic principles of scarcity and trade-offs, while the "Taxes on Producers" simulation delves into the more specific microeconomic impact of government intervention through taxation. Together, they exemplify the use of technology to create engaging and interactive learning experiences in economics.
Economic Principles: Production and Taxation
Quiz
- What is a Production Possibilities Curve (PPC) and what does it illustrate about an economy's choices?
- Explain the concept of opportunity cost in the context of a PPC. How is it represented on the curve?
- According to the provided materials, what is the general focus of the "Taxes on Producers Economics JavaScript HTML5 Applet Simulation Model"?
- List three specific learning goals mentioned in the "Taxes on Producers" resource that students might explore using the simulation.
- How might a tax on producers affect the supply of a good or service in a market? Explain your reasoning briefly.
- According to the "Taxes on Producers" resource, what are some of the key elements or outcomes related to producer taxes that can be examined?
- In the context of producer taxes, briefly distinguish between the tax revenue and the tax paid by consumers.
- How might a simulation like the "Taxes on Producers Economics JavaScript HTML5 Applet" be a useful tool for learning about economic concepts?
- Based on the titles of other listed simulations, what is the apparent format and interactive nature of the learning resources provided by "Open Educational Resources / Open Source Physics @ Singapore"?
- How do the "Production Possibilities Curve" and the concept of "Taxes on Producers" relate to the fundamental economic problem of scarcity?
Answer Key
- A Production Possibilities Curve (PPC) is a graphical representation showing the maximum possible output combinations of two goods or services an economy can produce with its available resources and technology. It illustrates the trade-offs and choices an economy faces due to scarcity.
- Opportunity cost is the value of the next best alternative forgone when making a choice. On a PPC, the opportunity cost of producing more of one good is represented by the amount of the other good that must be sacrificed, which is reflected by the slope of the curve.
- The "Taxes on Producers Economics JavaScript HTML5 Applet Simulation Model" primarily focuses on demonstrating and allowing users to explore the effects of taxes imposed directly on producers within an economic market.
- Three specific learning goals mentioned are understanding "tax per unit," "tax revenue," and "tax paid by consumers" in the context of taxes on producers.
- A tax on producers generally increases their costs of production. This increase in costs typically leads to a decrease in the supply of the good or service, meaning producers will be willing and able to offer less at each price level.
- Key elements or outcomes related to producer taxes that can be examined, according to the resource, include tax per unit, tax revenue, tax paid by consumers, tax paid by producers, expenditures, and revenue for firms (producers).
- Tax revenue is the total amount of money collected by the government as a result of the tax. Tax paid by consumers refers to the portion of the tax burden that is ultimately passed on to consumers through higher prices.
- A simulation like the "Taxes on Producers Economics JavaScript HTML5 Applet" can be a useful tool by providing an interactive and visual way to understand abstract economic concepts, allowing users to manipulate variables and observe the resulting changes in the market.
- Based on the titles, the learning resources appear to be interactive simulations in JavaScript and HTML5 format, allowing users to engage with models of various scientific and mathematical concepts through web browsers.
- Both the Production Possibilities Curve and the concept of Taxes on Producers address the fundamental economic problem of scarcity. The PPC shows the limits of what can be produced with scarce resources, while taxes on producers can affect the allocation and efficiency of these scarce resources in the production of goods and services.
Essay Format Questions
- Discuss how the Production Possibilities Curve effectively illustrates the concepts of scarcity, trade-offs, and opportunity cost for an economy. Provide specific examples of how movements along the curve and shifts of the curve relate to these fundamental economic principles.
- Explain the potential impacts of a per-unit tax levied on producers in a market. Consider how such a tax might affect supply, price, the quantity of goods exchanged, and the distribution of the tax burden between consumers and producers.
- Analyze the benefits and limitations of using simulation models, such as the "Taxes on Producers Economics JavaScript HTML5 Applet," as tools for learning economic principles. How do these interactive resources contribute to understanding compared to traditional methods of instruction?
- Considering both the Production Possibilities Curve and the concept of taxes on producers, discuss how government policies can influence the allocation of scarce resources and the overall productive capacity of an economy.
- Explore the relationship between the microeconomic concept of producer taxation and the macroeconomic implications for a nation's production possibilities. How might government taxation policies affect a country's ability to produce goods and services, as represented by its PPC?
Glossary of Key Terms
- Production Possibilities Curve (PPC): A graph that shows the maximum combinations of two goods or services that can be produced by an economy with a given set of resources and technology, assuming full employment and efficiency.
- Opportunity Cost: The value of the next best alternative forgone when a decision is made. In economics, it represents what must be given up in order to obtain something else.
- Scarcity: The fundamental economic problem of having seemingly unlimited human wants in a world of limited resources.
- Trade-off: The act of giving up one thing in order to gain another. Illustrated by the movement along the PPC.
- Tax per Unit: A fixed amount of tax levied on each unit of a good or service produced or sold.
- Tax Revenue: The total amount of money collected by the government from taxes.
- Tax Paid by Consumers: The portion of a tax burden that is ultimately borne by consumers, typically through higher prices.
- Tax Paid by Producers: The portion of a tax burden that is ultimately borne by producers, typically through reduced profits.
- Supply: The quantity of a good or service that producers are willing and able to offer for sale at various prices during a specific period.
- Simulation Model: A representation or imitation of a real-world system or process, often interactive and used for learning or analysis.
Sample Learning Goals
[text]
For Teachers
|
|
|
Taxes on Producers Economics JavaScript HTML5 Applet Simulation Model (direct link) |

|
|
|
tax per unit Taxes on Producers Economics JavaScript HTML5 Applet Simulation Model (direct link) |
|
|
|
tax revenue Taxes on Producers Economics JavaScript HTML5 Applet Simulation Model (direct link) |

|
|
|
tax paid by consumers Taxes on Producers Economics JavaScript HTML5 Applet Simulation Model (direct link) |
|
|
|
tax paid by producers Taxes on Producers Economics JavaScript HTML5 Applet Simulation Model (direct link) |

|
|
|
expenditures Taxes on Producers Economics JavaScript HTML5 Applet Simulation Model (direct link) |

|
|
|
revenue for firms (producers) Taxes on Producers Economics JavaScript HTML5 Applet Simulation Model (direct link) |
Research
[text]
Video
[text]
Version:
Other Resources
[text]
Frequently Asked Questions
- What is a Production Possibilities Curve (PPC)? A Production Possibilities Curve is a graphical representation that shows the maximum possible output combinations of two goods or services an economy can produce with its available resources and technology, assuming full and efficient utilization of these resources. It illustrates the trade-offs involved in allocating resources between different production activities.
- What does the shape of the PPC tell us about the opportunity cost of production? The shape of the PPC indicates the nature of the opportunity cost. A PPC that is bowed outward (concave to the origin) signifies increasing opportunity costs. This means that as the economy produces more of one good, the amount of the other good it must sacrifice increases. This is because resources are not equally suited to the production of all goods. A straight-line PPC, on the other hand, would indicate constant opportunity costs, implying resources are equally adaptable between the production of the two goods.
- How do taxes on producers affect an economy? Taxes imposed on producers increase their costs of production. This typically leads to a decrease in the supply of the good or service being taxed. The burden of the tax is often shared between consumers and producers, resulting in a higher price for consumers and lower net revenue for producers. The extent to which each group bears the burden depends on the elasticity of demand and supply. Taxes also generate tax revenue for the government, which can be used for public expenditures.
- What are some of the learning goals associated with studying taxes on producers using simulation models? Simulation models designed to illustrate taxes on producers aim to help learners understand several key concepts, including how a per-unit tax affects the supply curve, how the tax burden is distributed between consumers and producers, how tax revenue is generated, and how taxes influence expenditures and revenue for firms. These models often allow users to manipulate tax rates and observe the resulting changes in market equilibrium.
- What is the purpose of using JavaScript HTML5 applet simulation models in economics education? JavaScript HTML5 applet simulation models provide interactive and visual tools for learning economic concepts. They allow students to experiment with different scenarios, observe the effects of various factors (like taxes) in real-time, and develop a deeper intuitive understanding of economic principles. These models can make abstract concepts more concrete and engaging for learners.
- Can you provide examples of economic concepts that can be explored using JavaScript HTML5 applet simulations based on the provided text? Based on the text, examples of economic concepts that can be explored through these simulations include the impact of taxes on producers (including tax incidence, tax revenue), market equilibrium shifts due to changes in supply, and the general principles of production and resource allocation as represented by the Production Possibilities Curve (although a specific simulation for PPC isn't detailed, the platform hosts various economics simulations).
- Who are some of the key individuals or groups involved in developing these educational resources? The development of these open educational resources and simulation models involves individuals such as This email address is being protected from spambots. You need JavaScript enabled to view it., Francisco Esquembre, Félix J. García Clemente, and Evan Yeo (based on whose ideas some models are created). The Open Educational Resources / Open Source Physics @ Singapore initiative is a key group involved in hosting and providing these resources.
- Under what licensing terms are these educational resources available? The content is generally licensed under the Creative Commons Attribution-Share Alike 4.0 Singapore License, allowing for sharing and adaptation with appropriate attribution and under the same license terms. For commercial use of the EasyJavaScriptSimulations Library used in some models, separate licensing terms apply, which can be found at https://www.um.es/fem/EjsWiki/Main/EJSLicense, and inquiries should be directed to This email address is being protected from spambots. You need JavaScript enabled to view it..