
.png
)


Translations
| Code | Language | Translator | Run | |
|---|---|---|---|---|
 |
||||
Credits


This email address is being protected from spambots. You need JavaScript enabled to view it.; Francisco Esquembre; Flix J. Garca Clemente; based on ideas by Evan Yeo
Executive Summary:
This briefing document synthesizes information from two sources discussing the Production Possibilities Curve (PPC), also known as the Production Possibility Frontier (PPF). The PPC is a fundamental concept in economics that illustrates the trade-offs an economy or individual faces when allocating scarce resources between the production of two different goods. The curve demonstrates key economic principles such as scarcity, opportunity cost, productive efficiency, allocative efficiency, and the potential for economic growth or contraction. The provided interactive simulation further allows for a visual understanding of these concepts, particularly efficiency and opportunity cost.
Main Themes and Important Ideas/Facts:
1. Definition and Core Concept:
- The PPC/PPF is defined as "a curve which shows various combinations of a set of two goods which can be produced with the given resources and technology where the given resources are fully and efficiently utilized per unit time." (Source 2)
- The core idea is that producing more of one good necessitates producing less of another due to limited resources. This highlights the fundamental economic problem of scarcity. (Source 2)
- The concept applies not only to economies but also to "each individual, household, and economic organization." (Source 2)
2. Graphical Representation and Efficiency:
- The PPC graphically bounds the production set, showing the maximum possible production level of one good for any given production level of the other, given the existing technology. (Source 2)
- Points on the frontier (like B, D, and C in a typical graph referenced in Source 2) represent productive efficiency, indicating that available inputs are fully and efficiently utilized. (Source 2)
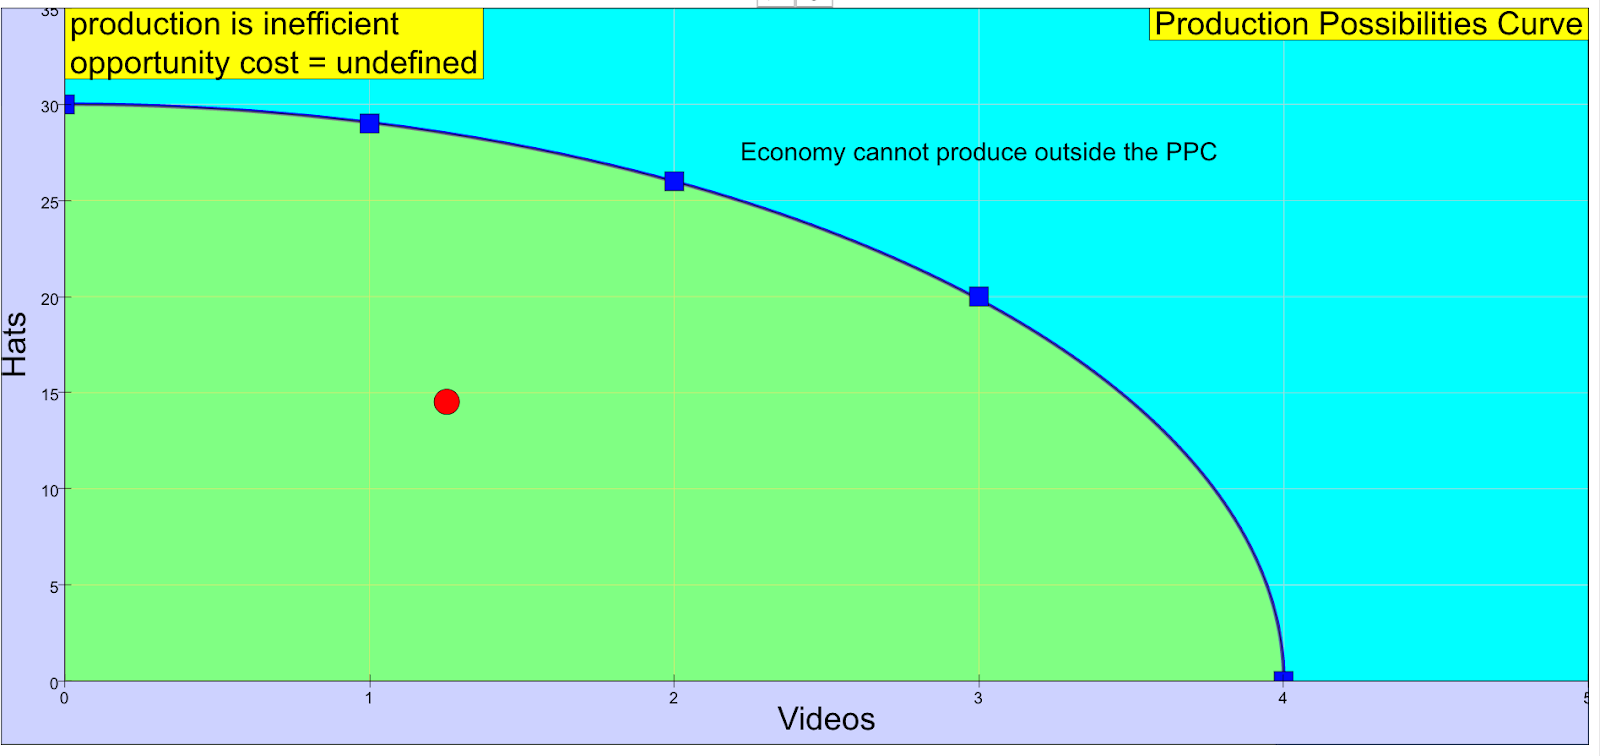
- Points beneath the curve (like A) signify inefficiency, implying that resources are not being fully or efficiently utilized. (Source 2) The interactive simulation reinforces this by showing that "any production inside the eclipse (Green color) is inefficient." (Source 2)
- Points beyond the curve (like X) represent impossibility with the current level of resources and technology. (Source 2) The simulation also indicates that "production at the maximum efficient point outside the eclipse (TEAL color) is not possible." (Source 2)
3. Opportunity Cost and Trade-offs:
- The PPC inherently illustrates opportunity cost, defined as "the sacrifice in the production of the second good...for one or more units of the first good." (Source 2)
- Moving along the PPC demonstrates the trade-off between the two goods. To increase the production of one good, resources must be diverted from the production of the other. (Source 2)
- The shape of the PPC is directly related to opportunity cost. The examples provided in Source 2 show that as more of one good (videos) is produced, the opportunity cost (in terms of hats forgone) typically increases.
- "The opportunity cost of producing 1 more video from 0 video is 1 hat"
- "The opportunity cost of producing 1 more video from 1 video is 3 hats"
- "The opportunity cost of producing 1 more video from 2 video is 6 hats"
- "The opportunity cost of producing 1 more video from 3 video is 20 hats"
- The marginal rate of transformation is mentioned as the ratio of gains to losses when moving along the PPF, representing the opportunity cost of producing one more unit of a good in terms of the other good forgone. (Source 2)
4. Shape of the PPC:
- PPFs are "normally drawn as bulging upwards or outwards from the origin ('concave' when viewed from the origin)," reflecting increasing opportunity costs. (Source 2)
- However, the shape can also be "bulging downward (inwards) or linear (straight), depending on a number of assumptions." (Source 2)
5. Shifts in the PPC:
- An outward shift of the PPC signifies economic growth. This can result from:
- "the growth of the availability of inputs, such as physical capital or labor" (Source 2)
- "technological progress in knowledge of how to transform inputs into outputs" (Source 2)
- Such a shift allows for the production of "more of both outputs...without sacrificing the output of either good." (Source 2)
- An inward shift of the PPC indicates an economic contraction. This can be caused by:
- "the labor force shrinks" (Source 2)
- "the supply of raw materials is depleted" (Source 2)
- "a natural disaster decreases the stock of physical capital" (Source 2)
- It's important to note that "most economic contractions reflect not that less can be produced but that the economy has started operating below the frontier," due to factors like underemployment of labor and capital. (Source 2)
6. Other Illustrated Concepts:
- Besides scarcity and opportunity cost, the PPC also illustrates:
- Productive efficiency (as discussed in point 2)
- Allocative efficiency (though not explicitly defined in detail in these excerpts, it relates to producing the combination of goods that society most desires)
- Economies of scale (the cost advantages that enterprises obtain due to size, output, or scale of operation - the connection to the PPC shape isn't elaborated in these sources) (Source 2)
7. Interactive Simulation:
- The second source explicitly mentions an "interactive" JavaScript HTML5 applet simulation model. (Source 2)
- This simulation allows users to "dragging on the production point" to observe the concepts of efficiency and impossibility visually. (Source 2)
- It also demonstrates the concept of opportunity cost through interactive manipulation. (Source 2)
Quotes:
- "A production–possibility frontier (PPF) or production possibility curve (PPC) is a curve which shows various combinations of a set of two goods which can be produced with the given resources and technology where the given resources are fully and efficiently utilized per unit time." (Source 2)
- "Graphically bounding the production set for fixed input quantities, the PPF curve shows the maximum possible production level of one commodity for any given production level of the other, given the existing state of technology." (Source 2)
- "a point on the frontier indicates efficient use of the available inputs...a point beneath the curve...indicates inefficiency, and a point beyond the curve...indicates impossibility." (Source 2)
- "An outward shift of the PPC results from the growth of the availability of inputs...or from technological progress..." (Source 2)
- "From a starting point on the frontier, if there is no increase in productive resources, increasing production of a first good entails decreasing the production of a second...The sacrifice in the production of the second good is called the opportunity cost..." (Source 2)
Conclusion:
The provided sources clearly define the Production Possibilities Curve as a vital tool for understanding fundamental economic concepts related to resource allocation and trade-offs. The PPC visually represents the limits of production given existing resources and technology, highlighting scarcity, opportunity cost, and efficiency. Shifts in the curve illustrate the potential for economic growth or contraction. The accompanying interactive simulation offers a valuable pedagogical tool for visualizing and exploring these core economic principles.
Production Possibilities Curve Study Guide
Quiz
Answer the following questions in 2-3 sentences each.
- What is the primary purpose of a Production Possibilities Frontier (PPF) or Production Possibility Curve (PPC)?
- Explain the concept of productive efficiency in the context of a PPF. Where would an inefficient point lie on a graph?
- What does an outward shift of the PPF indicate for an economy's production capabilities? What are two potential causes of such a shift?
- Explain why points beyond the current PPF are considered impossible in the short run.
- What is opportunity cost in the context of the PPF? How is it illustrated by moving along the curve?
- Define the marginal rate of transformation (MRT) and explain its relationship to the opportunity cost shown on a PPF.
- How does the shape of a typical PPF (concave to the origin) reflect the concept of increasing opportunity costs?
- What does a point lying beneath the PPF indicate about the utilization of resources within an economy?
- Describe a scenario that would cause the PPF to shift inward. What does this signify for the economy?
- How does the interactive simulation described in the text help visualize the concepts of efficiency and possibility in relation to the PPF?
Quiz Answer Key
- The primary purpose of a Production Possibilities Frontier (PPF) is to illustrate the maximum possible combinations of two goods that can be produced with a given set of resources and technology, assuming full and efficient utilization of those resources. It visually represents the trade-offs inherent in allocating scarce resources between different production activities.
- Productive efficiency on a PPF means that the economy is using all of its available resources fully and effectively to produce the maximum possible output of goods. Graphically, a point on the PPF curve represents productive efficiency, while a point beneath the curve indicates inefficiency or underutilization of resources.
- An outward shift of the PPF indicates economic growth and an increase in the economy's capacity to produce both goods. This shift can be caused by factors such as an increase in the availability of resources (like capital or labor) or advancements in technology that improve the efficiency of production.
- Points beyond the current PPF are considered impossible in the short run because they represent production levels that cannot be achieved with the existing quantity of resources and the current state of technology. Reaching such points would require either more resources or technological advancements.
- Opportunity cost in the context of a PPF is the amount of one good that must be sacrificed to produce an additional unit of another good. As you move along the PPF from producing more of one good, you must produce less of the other, and this trade-off represents the opportunity cost.
- The marginal rate of transformation (MRT) is the rate at which one good can be transformed into another along the PPF. It is numerically equal to the slope of the PPF at a given point and represents the opportunity cost of producing one more unit of a good in terms of the other good forgone.
- A PPF that is concave to the origin (bulging outwards) reflects the concept of increasing opportunity costs. This means that as the economy specializes in the production of one good, the opportunity cost of producing an additional unit of that good (in terms of the other good sacrificed) increases because resources are not equally suited to the production of both goods.
- A point lying beneath the PPF indicates that the economy is not utilizing its resources fully or efficiently. This could be due to factors such as unemployment, underemployment of capital, or inefficient production processes, resulting in an output level below the maximum potential.
- A scenario that would cause the PPF to shift inward could be a decrease in the labor force, depletion of natural resources, or a natural disaster that destroys physical capital. An inward shift signifies a contraction in the economy's production capabilities, meaning less of both goods can now be produced.
- The interactive simulation allows users to visualize how different production points relate to the PPF, with areas inside the curve highlighted as inefficient and the line representing maximum efficiency. Points outside the curve are shown as unattainable, directly illustrating the concepts of productive efficiency and the limits of production possibilities.
Essay Format Questions
- Explain the relationship between the shape of the Production Possibilities Curve (PPC) and the concept of opportunity cost. Discuss how different PPC shapes (concave, linear, convex) illustrate varying opportunity cost scenarios within an economy.
- Analyze the factors that can cause a Production Possibilities Frontier (PPF) to shift outward. Discuss the implications of such a shift for an economy's standard of living and future economic potential, providing specific examples of these factors and their impact.
- Discuss the concepts of productive efficiency and allocative efficiency in the context of the Production Possibilities Curve (PPC). Explain how a point on the PPC demonstrates productive efficiency, but not necessarily allocative efficiency, and what determines allocative efficiency.
- Explain how the Production Possibilities Frontier (PPF) illustrates the fundamental economic problem of scarcity and the need for trade-offs. Use specific examples to demonstrate how the PPF visually represents the limitations imposed by scarce resources and the choices societies must make.
- Critically evaluate the usefulness of the Production Possibilities Curve (PPC) as a model for understanding real-world economies. Discuss its strengths and limitations in representing the complexities of production, resource allocation, and economic growth in diverse economies.
Glossary of Key Terms
- Production Possibilities Frontier (PPF) / Production Possibility Curve (PPC): A graphical representation showing the maximum possible combinations of two goods or services that can be produced with a given set of resources and technology, assuming full and efficient utilization of those resources.
- Scarcity: The fundamental economic problem of having seemingly unlimited human wants in a world of limited resources. The PPF illustrates the constraints imposed by scarcity.
- Opportunity Cost: The value of the next best alternative forgone when making a choice. On the PPF, it is the amount of one good that must be sacrificed to produce an additional unit of another good.
- Productive Efficiency: A situation where an economy is producing the maximum possible output from its available resources and technology. Graphically represented by points on the PPF.
- Allocative Efficiency: A situation where resources are allocated in a way that produces the goods and services that society values most. This is represented by a specific point on the PPF that aligns with societal preferences.
- Inefficiency: A situation where an economy is producing below its maximum potential output, meaning resources are not being fully or effectively utilized. Graphically represented by points inside the PPF.
- Impossibility: Production levels that are beyond the current capacity of the economy given its resources and technology. Graphically represented by points outside the PPF.
- Marginal Rate of Transformation (MRT): The rate at which one good can be transformed into another along the PPF; it is the slope of the PPF and represents the opportunity cost of producing one more unit of a good in terms of the other good forgone.
- Economic Growth: An increase in the economy's ability to produce goods and services over time, often represented by an outward shift of the PPF. This can be caused by factors like increased resources or technological progress.
- Trade-off: The act of giving up one thing in order to gain another. The PPF inherently illustrates the trade-offs involved in allocating scarce resources between different production possibilities.
Sample Learning Goals
[text]
For Teachers
A production–possibility frontier (PPF) or production possibility curve (PPC) is a curve which shows various combinations of a set of two goods which can be produced with the given resources and technology where the given resources are fully and efficiently utilized per unit time. One good can only be produced by diverting resources from other goods, and so by producing less of them. This tradeoff is usually considered for an economy but also applies to each individual, household, and economic organization.
Graphically bounding the production set for fixed input quantities, the PPF curve shows the maximum possible production level of one commodity for any given production level of the other, given the existing state of technology. By doing so, it defines productive efficiency in the context of that production set: a point on the frontier indicates efficient use of the available inputs (such as points B, D and C in the graph), a point beneath the curve (such as A) indicates inefficiency, and a point beyond the curve (such as X) indicates impossibility.
An outward shift of the PPC results from the growth of the availability of inputs, such as physical capital or labor, or from technological progress in knowledge of how to transform inputs into outputs. Such a shift reflects, for instance, economic growth of an economy already operating at its full productivity (on the PPF), which means that more of both outputs can now be produced during the specified period of time without sacrificing the output of either good. Conversely, the PPF will shift inward if the labor force shrinks, the supply of raw materials is depleted, or a natural disaster decreases the stock of physical capital.
However, most economic contractions reflect not that less can be produced but that the economy has started operating below the frontier, as typically, both labor and physical capital are underemployed, remaining therefore idle.
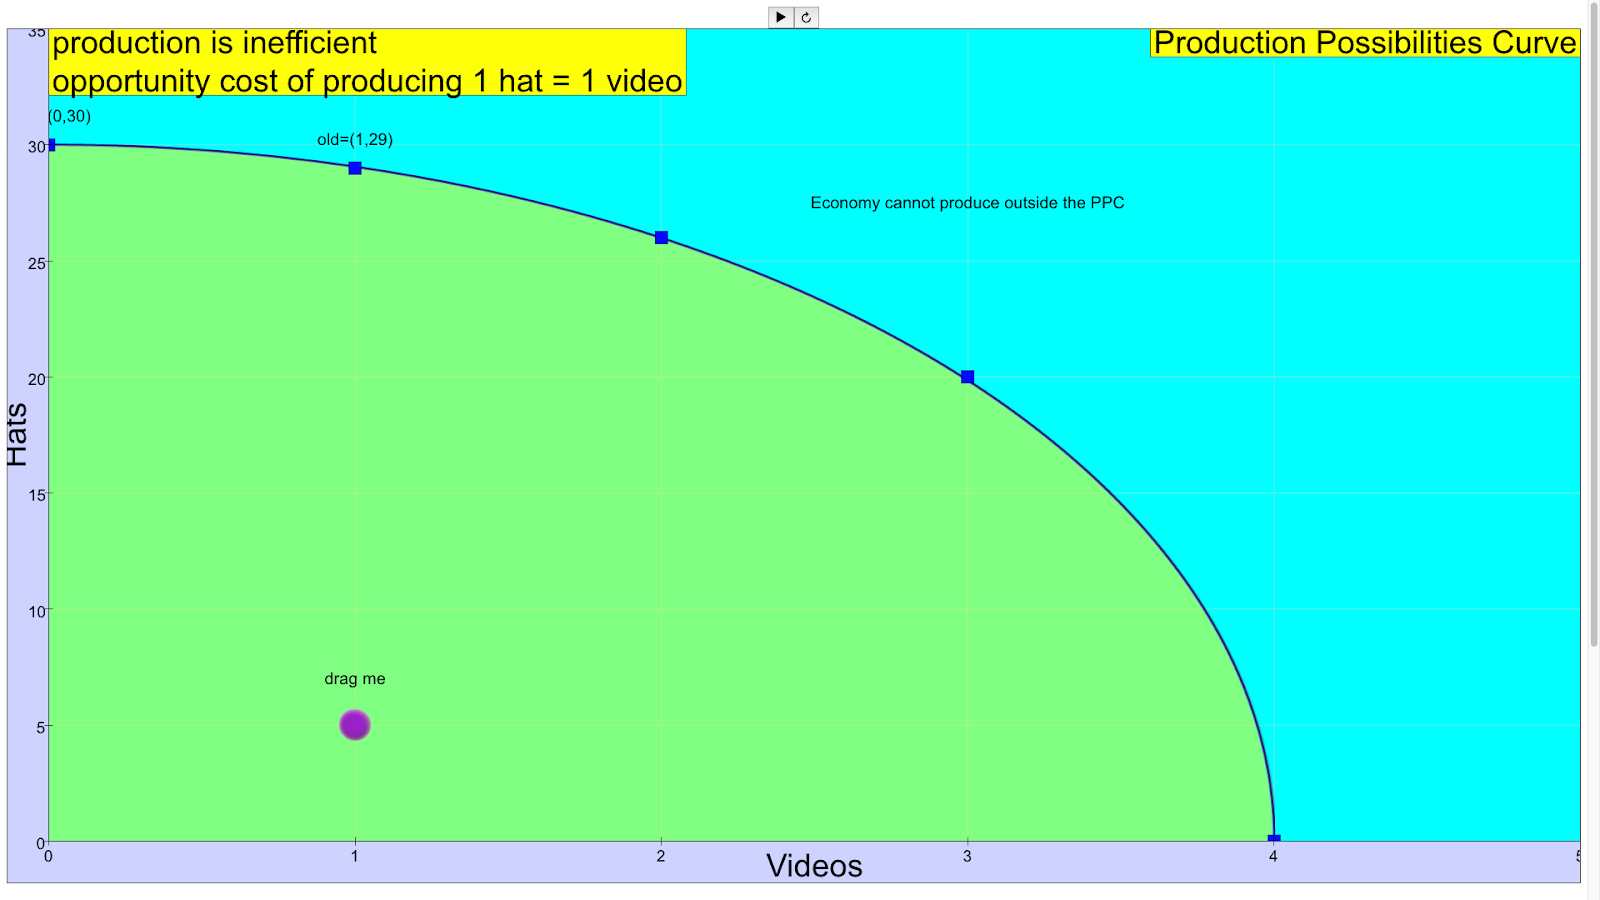
This interactive allows the dragging on the production point, any production
inside the eclipse (Green color) is inefficient.
 |
| production at the inefficient point |
on the eclipse line is efficient, or maximum efficiency.
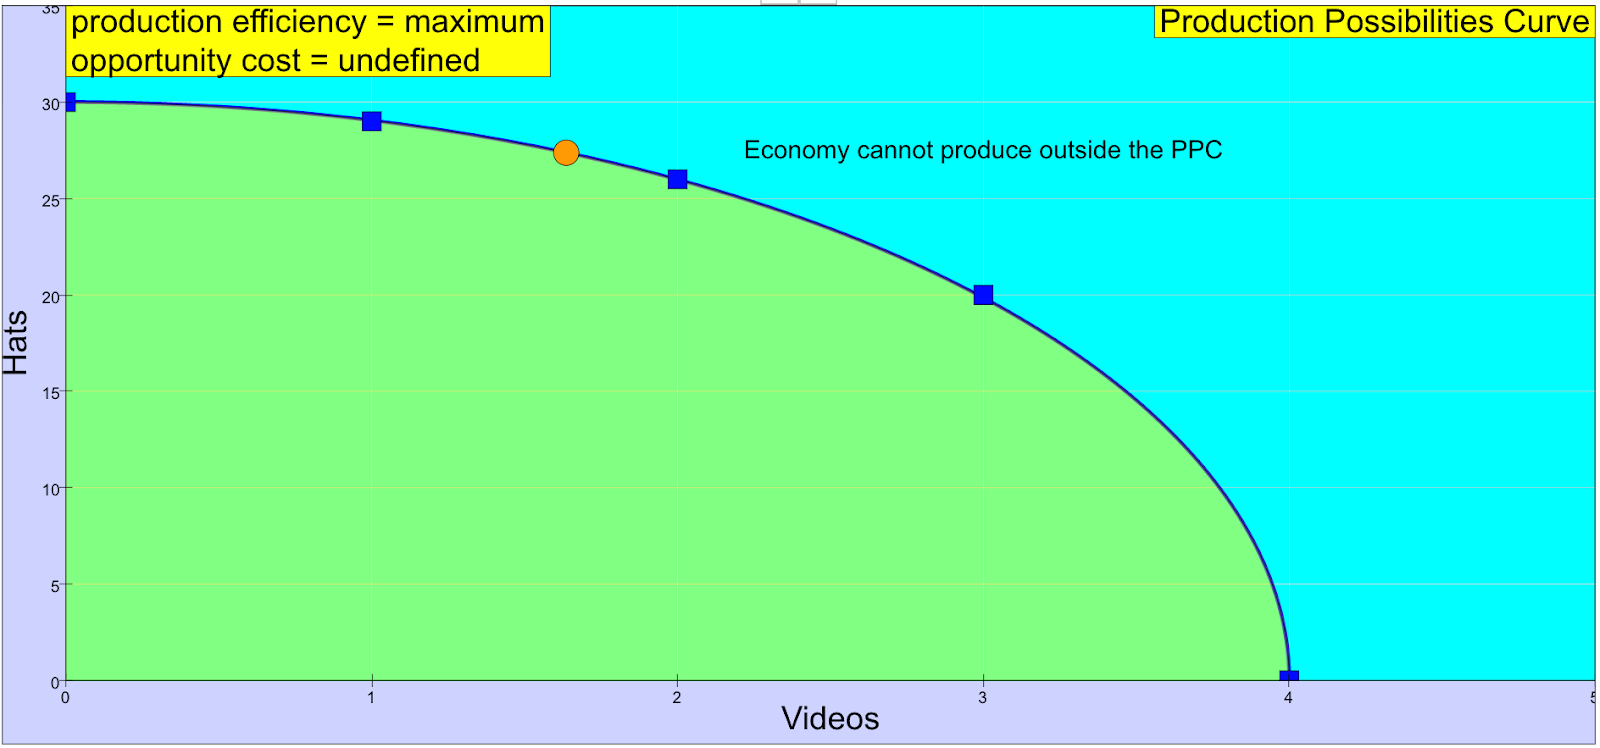 |
| production at the maximum efficient point |
outside the eclipse (TEAL color) is not possible.
The other concept illustrated is the opportunity cost.
From a starting point on the frontier, if there is no increase in productive resources, increasing production of a first good entails decreasing the production of a second, because resources must be transferred to the first and away from the second. Points along the curve describe the tradeoff between the goods. The sacrifice in the production of the second good is called the opportunity cost (because increasing production of the first good entails losing the opportunity to produce some amount of the second). Opportunity cost is measured in the number of units of the second good forgone for one or more units of the first good.[1]
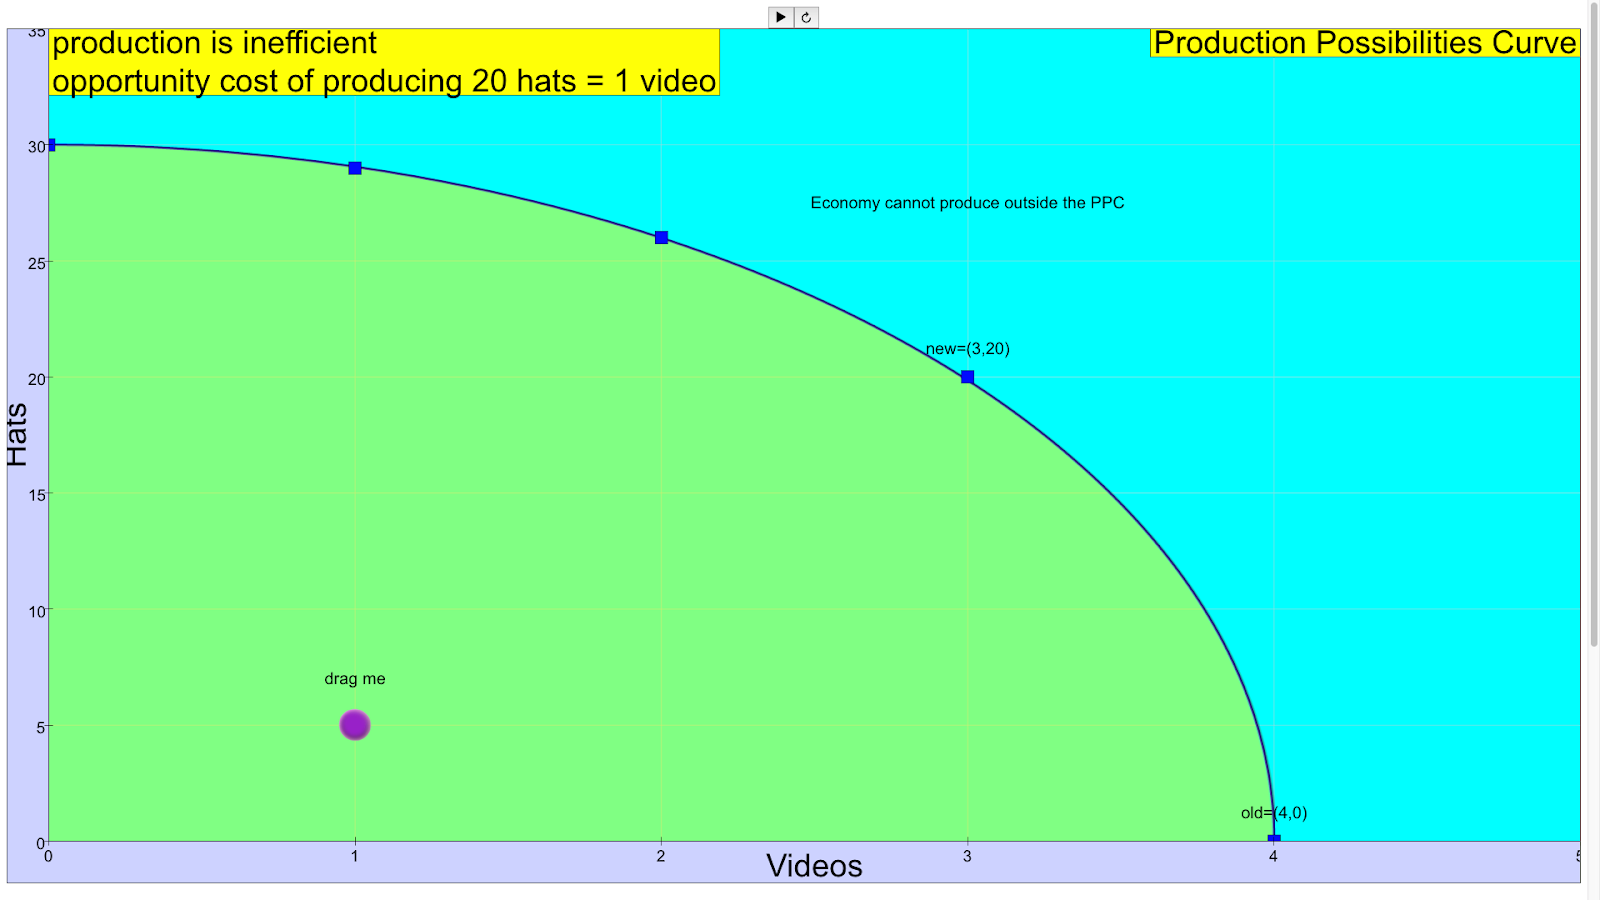
In the context of a PPF, the opportunity cost is directly related to the shape of the curve (see below). For example, to produce 1 more video from 3 videos, 20 hats must be sacrificed. The ratio of gains to losses is determined by the marginal rate of transformation.
Opportunity Cost of one more video
|
|
|
The opportunity cost of producing 1 more video from 0 video is 1 hat |

|
|
|
The opportunity cost of producing 1 more video from 1 video is 3 hats |

|
|
|
The opportunity cost of producing 1 more video from 2 video is 6 hats |

|
|
|
The opportunity cost of producing 1 more video from 3 video is 20 hats |

Opportunity Cost of more hats
|
|
|
The opportunity cost of producing 20 more hats from 0 hat is 1 video |
|
|
|
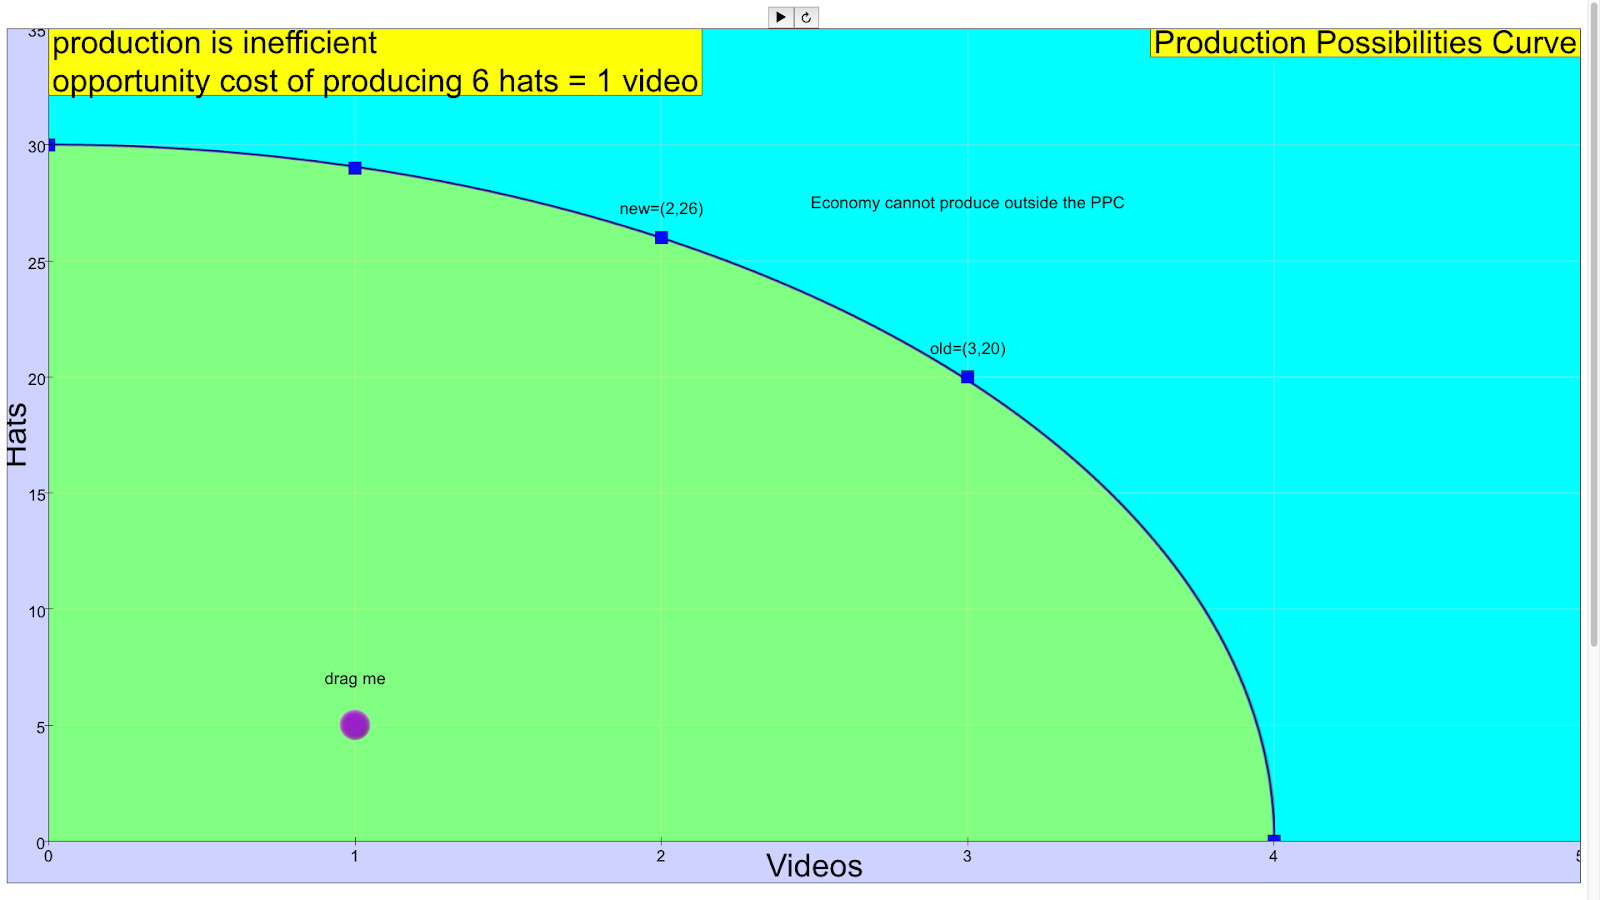
The opportunity cost of producing 6 more hats from 1 hat is 1 video |
|
|
|
The opportunity cost of producing 3 more hats from 2 hats is 1 video |

|
|
|
The opportunity cost of producing 1 more hat from 29 hats is 1 video |
[text]
Video
Production Possibilities Curve- Econ 1.1 by Jacob Clifford
Version:
Other Resources
[text]
FAQ: Understanding the Production Possibilities Curve (PPC)
1. What is the Production Possibilities Curve (PPC) or Production Possibility Frontier (PPF)?
The PPC or PPF is a graphical representation that illustrates the maximum possible combinations of two goods or services that an economy (or an individual, household, or organization) can produce within a specific time period, given its available resources and technology, assuming these resources are fully and efficiently utilized. It defines the boundary between what can be produced and what cannot.
2. What key economic concepts does the PPC demonstrate?
The PPC is a powerful tool for illustrating several fundamental economic concepts, including: * Scarcity: The limited nature of resources means that producing more of one good necessitates producing less of another, as depicted by the downward slope of the curve. * Opportunity Cost: Moving along the PPC shows the amount of one good that must be sacrificed to produce an additional unit of the other good. This tradeoff is the opportunity cost. * Productive Efficiency: Points lying on the PPC represent efficient use of all available resources. At these points, it's impossible to produce more of one good without decreasing the production of the other. * Inefficiency: Points inside the PPC indicate that resources are not being fully or efficiently utilized. It's possible to produce more of at least one good without reducing the production of the other. * Impossibility: Points outside the PPC are currently unattainable with the existing resources and technology. * Marginal Rate of Transformation (MRT): The slope of the PPC at any given point represents the MRT, which is the rate at which one good can be transformed into another by reallocating resources. It also reflects the opportunity cost of producing one more unit of a good.
3. Why is the PPC typically drawn as concave (bowed outwards) from the origin?
The typical concave shape of the PPC reflects the law of increasing opportunity costs. This law states that as an economy shifts resources from the production of one good to another, the opportunity cost of producing the additional unit of the second good will increase. This happens because resources are often specialized; some are better suited for producing one good than the other. As more resources are shifted, those less suited for the new good must be used, leading to larger sacrifices of the other good for each additional unit produced.
4. Can the PPC ever be linear (a straight line) or concave inwards (bowed inwards)?
Yes, the shape of the PPC depends on the underlying assumptions about resource specialization and the rate of transformation. * A linear PPC suggests constant opportunity costs. This would occur if resources were perfectly adaptable between the production of both goods, meaning the tradeoff remains the same regardless of the production levels. * A PPC that is concave inwards (though less common in standard economic models) would imply decreasing opportunity costs. This could happen under specific circumstances, such as significant economies of scale in the production of one or both goods as production increases.
5. What does a movement along the PPC signify?
A movement along the PPC illustrates the concept of trade-offs and opportunity cost. To increase the production of one good, the economy must decrease the production of the other good, assuming all resources are already efficiently employed. Each point on the curve represents a different combination of the two goods that can be produced with full and efficient resource utilization.
6. What causes the PPC to shift?
The PPC can shift inward or outward, reflecting changes in the economy's productive capacity: * Outward Shift (Economic Growth): This occurs when there is an increase in the availability of resources (e.g., more labor, capital, natural resources) or advancements in technology that improve the efficiency of production for one or both goods. An outward shift means the economy can now produce more of both goods than before without sacrificing the output of either. * Inward Shift (Economic Contraction): This occurs when there is a decrease in the availability of resources (e.g., a shrinking labor force, depletion of raw materials, destruction of capital due to natural disasters) or a decline in technological knowledge. An inward shift means the economy can now produce less of both goods.
7. What is the difference between operating on, inside, and outside the PPC?
* Operating **on** the PPC signifies that the economy is using all its available resources efficiently and is producing the maximum possible output of the two goods.
* Operating **inside** the PPC indicates that the economy is not using its resources fully or efficiently. There is underemployment of labor or capital, or resources are being misallocated. In this situation, it's possible to increase the production of one or both goods without decreasing the production of the other.
* Operating **outside** the PPC is currently impossible given the existing resources and technology. Achieving this level of production would require either an increase in resources or technological advancements that shift the PPC outward.
8. How does the concept of opportunity cost relate to the shape and movement along the PPC?
Opportunity cost is intrinsically linked to the PPC. As you move along the concave PPC to produce more of one good, you must forgo increasingly larger amounts of the other good. This increasing sacrifice is the increasing opportunity cost, reflected in the changing slope (MRT) of the curve. The PPC visually quantifies this trade-off, showing precisely how much of one good must be given up to gain an additional unit of the other at different points on the frontier.