
Breadcrumbs
- You are here:
-
Home

-
Interactive Resources
- Chemistry
Chemistry
- http://www.chm.davidson.edu/vce/index.html: Virtual Chemistry Experiments. This is a series of tutorials, or learning progressions, on topics gasses and chemistry. The experiments are a bit difficult to run at times. Perhaps very good, or good. Chemistry focus so there are some physics mistakes in the material, but overall it can be useful for thermodynamics classes.

- Details
- Written by Loo Kang Wee
- Parent Category: Interactive Resources
- Category: Chemistry
- Hits: 643

- Details
- Written by Loo Kang Wee
- Parent Category: Interactive Resources
- Category: Chemistry
- Hits: 1697
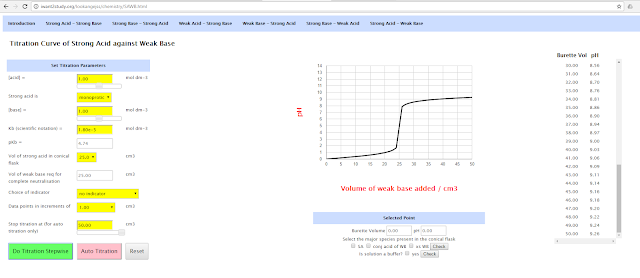
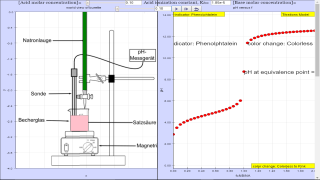
Read more: Acid-Base Titration Curve Explorer: Interactive Chemistry Learning Tool

- Details
- Written by Loo Kang Wee
- Parent Category: Interactive Resources
- Category: Chemistry
- Hits: 1153
Read more: Singapore Air Quality Data Visualization: Real-World Environmental Science

- Details
- Written by Loo Kang Wee
- Parent Category: Interactive Resources
- Category: Chemistry
- Hits: 1409

- Details
- Written by Loo Kang Wee
- Parent Category: Interactive Resources
- Category: Chemistry
- Hits: 4267

- Details
- Written by Loo Kang Wee
- Parent Category: Interactive Resources
- Category: Chemistry
- Hits: 4412
Read more: Project 2b: webEJS workshop Game for Chemistry Ions matching Chemical Name by Winnie

- Details
- Written by Loo Kang Wee
- Parent Category: Interactive Resources
- Category: Chemistry
- Hits: 4096
- Details
- Written by Loo Kang Wee
- Parent Category: Interactive Resources
- Category: Chemistry
- Hits: 8586
Read more: Chemistry Matching Game according to Columns for Elements, Compounds and Mixtures
- Details
- Written by Loo Kang Wee
- Parent Category: Interactive Resources
- Category: Chemistry
- Hits: 17243
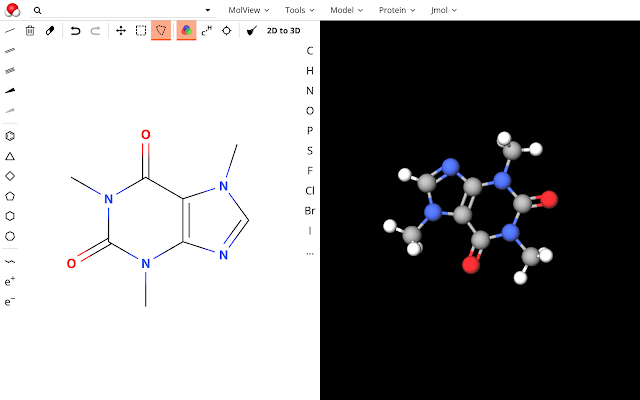
Read more: MolView Open-Source web-application for Chemistry Drawing
- Details
- Written by Grace Leong
- Parent Category: Interactive Resources
- Category: Chemistry
- Hits: 29090
- Details
- Written by Shaun
- Parent Category: Chemistry
- Category: 01 Experimental Chemistry
- Hits: 6125
Read more: 🧩Matching Game using GHS Symbols for Lower Secondary 2021 JavaScript HTML5 Applet
- Details
- Written by Loo Kang Wee
- Parent Category: Chemistry
- Category: 01 Experimental Chemistry
- Hits: 28488
Read more: Separation Techniques Lower Secondary Science Interactive Resource for Chemistry Learning
- Details
- Written by Loo Kang Wee
- Parent Category: Chemistry
- Category: 02 Atomic Structure and Stoichiometry
- Hits: 5060
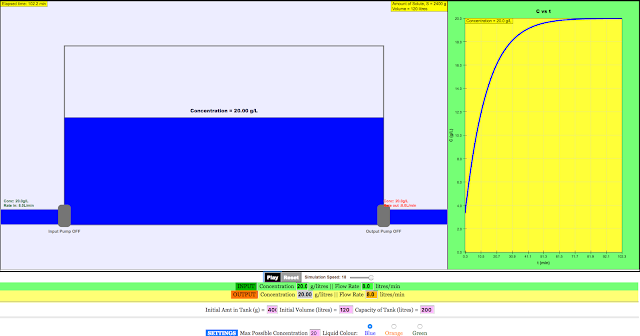
Read more: Tank 2 Concentration JavaScript HTML5 Applet Simulation Model by Lam MH

- Details
- Written by Jonathan
- Parent Category: Chemistry
- Category: 02 Atomic Structure and Stoichiometry
- Hits: 5967
Read more: Mass spectrometer JavaScript HTML5 Applet Simulation Model by Luo Kangshun, Andy

- Details
- Written by Jonathan
- Parent Category: Chemistry
- Category: 02 Atomic Structure and Stoichiometry
- Hits: 5792
Read more: Stereochemistry JavaScript HTML5 Applet Simulation Model by Luo Kangshun, Andy

- Details
- Written by Jonathan
- Parent Category: Chemistry
- Category: 02 Atomic Structure and Stoichiometry
- Hits: 7807
Read more: X-Ray crystallography JavaScript HTML5 Applet Simulation Model by Luo Kangshun, Andy

- Details
- Written by Jonathan
- Parent Category: Chemistry
- Category: 02 Atomic Structure and Stoichiometry
- Hits: 5847
Read more: Molecular Geometry JavaScript HTML5 Applet Simulation Model by Luo Kangshun, Andy
- Details
- Written by Luo, Andy
- Parent Category: Chemistry
- Category: 02 Atomic Structure and Stoichiometry
- Hits: 5668
- Details
- Written by Fremont
- Parent Category: Chemistry
- Category: 02 Atomic Structure and Stoichiometry
- Hits: 7906
Read more: Tank Concentration JavaScript HTML5 Applet Simulation Model by Lam MH

- Details
- Written by Luo, Andy
- Parent Category: 02 Atomic Structure and Stoichiometry
- Category: 01 The Particulate Nature of Matter
- Hits: 5580

- Details
- Parent Category: 02 Atomic Structure and Stoichiometry
- Category: 01 The Particulate Nature of Matter
- Hits: 8520

- Details
- Parent Category: 02 Atomic Structure and Stoichiometry
- Category: 01 The Particulate Nature of Matter
- Hits: 13467
- Details
- Parent Category: 02 Atomic Structure and Stoichiometry
- Category: 02 Formulae, Stoichiometry and the Mole Concept
- Hits: 9316

- Details
- Parent Category: 02 Atomic Structure and Stoichiometry
- Category: 02 Formulae, Stoichiometry and the Mole Concept
- Hits: 10934

- Details
- Parent Category: 02 Atomic Structure and Stoichiometry
- Category: 02 Formulae, Stoichiometry and the Mole Concept
- Hits: 8809

- Details
- Parent Category: 02 Atomic Structure and Stoichiometry
- Category: 02 Formulae, Stoichiometry and the Mole Concept
- Hits: 21654
Read more: Balancing Chemical Equations by PHET Interactive Resource for Chemistry Learning

- Details
- Parent Category: 02 Atomic Structure and Stoichiometry
- Category: 02 Formulae, Stoichiometry and the Mole Concept
- Hits: 9678

- Details
- Parent Category: 02 Atomic Structure and Stoichiometry
- Category: 02 Formulae, Stoichiometry and the Mole Concept
- Hits: 11182


- Details
- Written by Loo Kang Wee
- Parent Category: Chemistry
- Category: 03 Chemistry of Reactions
- Hits: 2718

- Details
- Written by Loo Kang Wee
- Parent Category: Chemistry
- Category: 03 Chemistry of Reactions
- Hits: 2766
- Details
- Written by Loo Kang Wee
- Parent Category: Chemistry
- Category: 03 Chemistry of Reactions
- Hits: 12603
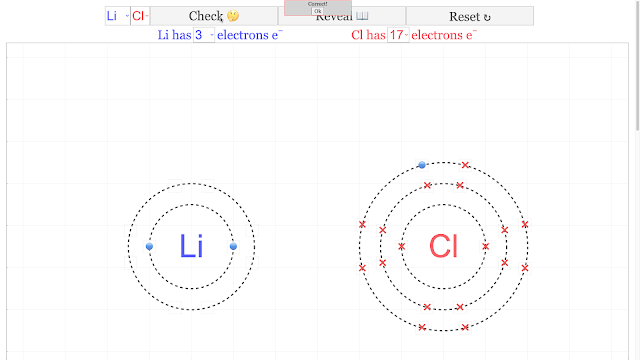
Read more: O level Chemical Ionic Bonding Dot and Cross Diagrams JavaScript Simulation Applet HTML5

- Details
- Written by David Loh
- Parent Category: Chemistry
- Category: 03 Chemistry of Reactions
- Hits: 9817
- Details
- Written by David Loh
- Parent Category: Chemistry
- Category: 03 Chemistry of Reactions
- Hits: 8792
- Details
- Written by David Loh
- Parent Category: Chemistry
- Category: 03 Chemistry of Reactions
- Hits: 9282
- Details
- Written by David Loh
- Parent Category: Chemistry
- Category: 03 Chemistry of Reactions
- Hits: 10897
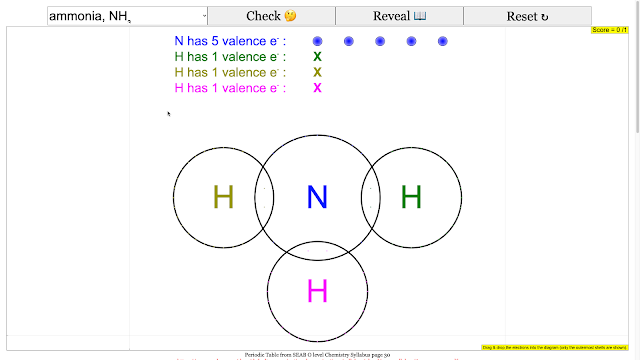
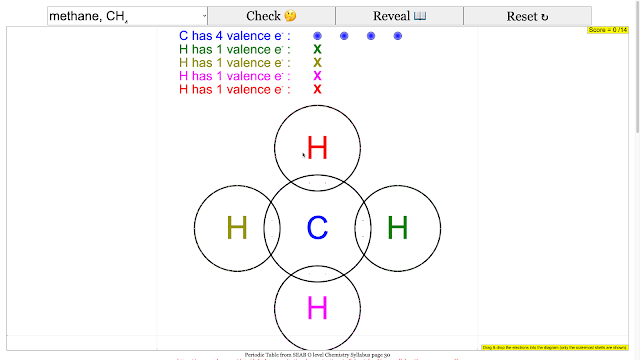
Read more: A Level Chemical Bonding Dot and Cross Diagrams JavaScript Simulation Applet HTML5
- Details
- Written by David Loh
- Parent Category: Chemistry
- Category: 03 Chemistry of Reactions
- Hits: 35327

- Details
- Written by Loo Kang Wee
- Parent Category: Chemistry
- Category: 03 Chemistry of Reactions
- Hits: 16206
Read more: 🧪Balancing Chemistry Equation JavaScript Simulation Applet HTML5
- Details
- Written by Loo Kang Wee
- Parent Category: Chemistry
- Category: 03 Chemistry of Reactions
- Hits: 15400
Read more: 🧪Acid Strong Base Titrations JavaScript Model by Fernando Silva Fernandes

- Details
- Written by Loo Kang Wee
- Parent Category: 03 Chemistry of Reactions
- Category: 01 Electrolysis
- Hits: 1570
Read more: Water Electrolysis Simulation: Virtual Chemistry Lab for Understanding H₂O Decomposition

- Details
- Written by Loo Kang Wee
- Parent Category: 03 Chemistry of Reactions
- Category: 01 Electrolysis
- Hits: 31418
Read more: Electrolysis Model Simulator Simulation for Chemistry Learning

- Details
- Written by Fremont
- Parent Category: 03 Chemistry of Reactions
- Category: 03 Chemical Reactions
- Hits: 2122

- Details
- Written by Loo Kang Wee
- Parent Category: 03 Chemistry of Reactions
- Category: 03 Chemical Reactions
- Hits: 26206
Read more: Unlocking Chemistry with EJS: Dive Into the Interactive World , Molecular and Symbolic...

- Details
- Written by Loo Kang Wee
- Parent Category: 03 Chemistry of Reactions
- Category: 03 Chemical Reactions
- Hits: 27104

- Details
- Written by Loo Kang Wee
- Parent Category: 03 Chemistry of Reactions
- Category: 03 Chemical Reactions
- Hits: 7984

- Details
- Written by Loo Kang Wee
- Parent Category: 03 Chemistry of Reactions
- Category: 03 Chemical Reactions
- Hits: 10927

- Details
- Written by Lawrence Wee
- Parent Category: 03 Chemistry of Reactions
- Category: 03 Chemical Reactions
- Hits: 11794

|
| Acid-Base Indicator Testing Lab.zip Acid-Base Indicator Testing Lab.html |
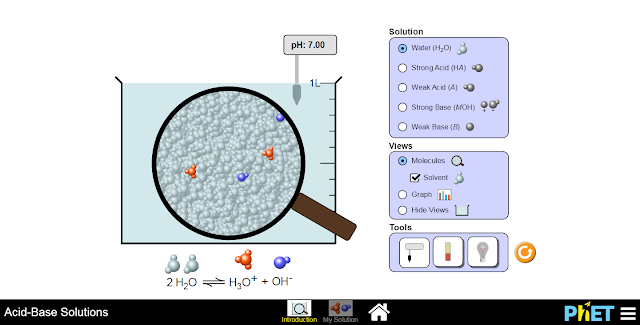
Explore acid-base chemistry safely with this virtual lab simulation. Students can test various substances with different indicators, observe color changes, and develop understanding of pH concepts without handling hazardous chemicals.
- Details
- Written by Loo Kang Wee
- Parent Category: 03 Chemistry of Reactions
- Category: 04 Acids, Bases and Salts
- Hits: 2048
Read more: Acid-Base Indicator Testing Lab: Virtual Chemistry Experiments for Safe Learning
Subcategories
01 Experimental Chemistry Article Count: 2
02 Atomic Structure and Stoichiometry Article Count: 18
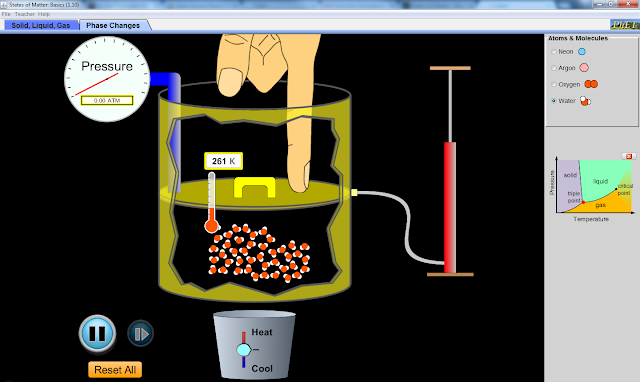
01 The Particulate Nature of Matter Article Count: 4
02 Formulae, Stoichiometry and the Mole Concept Article Count: 6
03 Chemistry of Reactions Article Count: 21
01 Electrolysis Article Count: 2
03 Chemical Reactions Article Count: 6
04 Acids, Bases and Salts Article Count: 2
04 Periodicity Article Count: 2
01 The Periodic Table Article Count: 1
05 Atmosphere Article Count: 0
06 Organic Chemistry Article Count: 1
Page 1 of 2