
About
For Teachers
Credits
Author: Andy video, Lawrence model
Contact: yeo_wei_yong_andy@moe.edu.sg
Title: "Tracker 3/6 Basketball: Using Model Builder to Simplify Graphs for Secondary School"
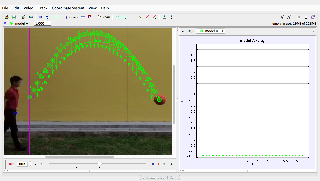
This document presents the analysis of a basketball’s motion using Tracker software and its Model Builder tool. It focuses on simplifying graphical representations of projectile motion, tailored for secondary school students to learn core physics concepts.
Study Guide:
Objective:
- Analyze the motion of a basketball as it moves through its trajectory.
- Use Model Builder to create simplified and visually clear graphs for educational purposes.
Key Concepts:
-
Projectile Motion:
- The motion of an object launched into the air, affected only by gravity and initial velocity.
-
Key Graphs:
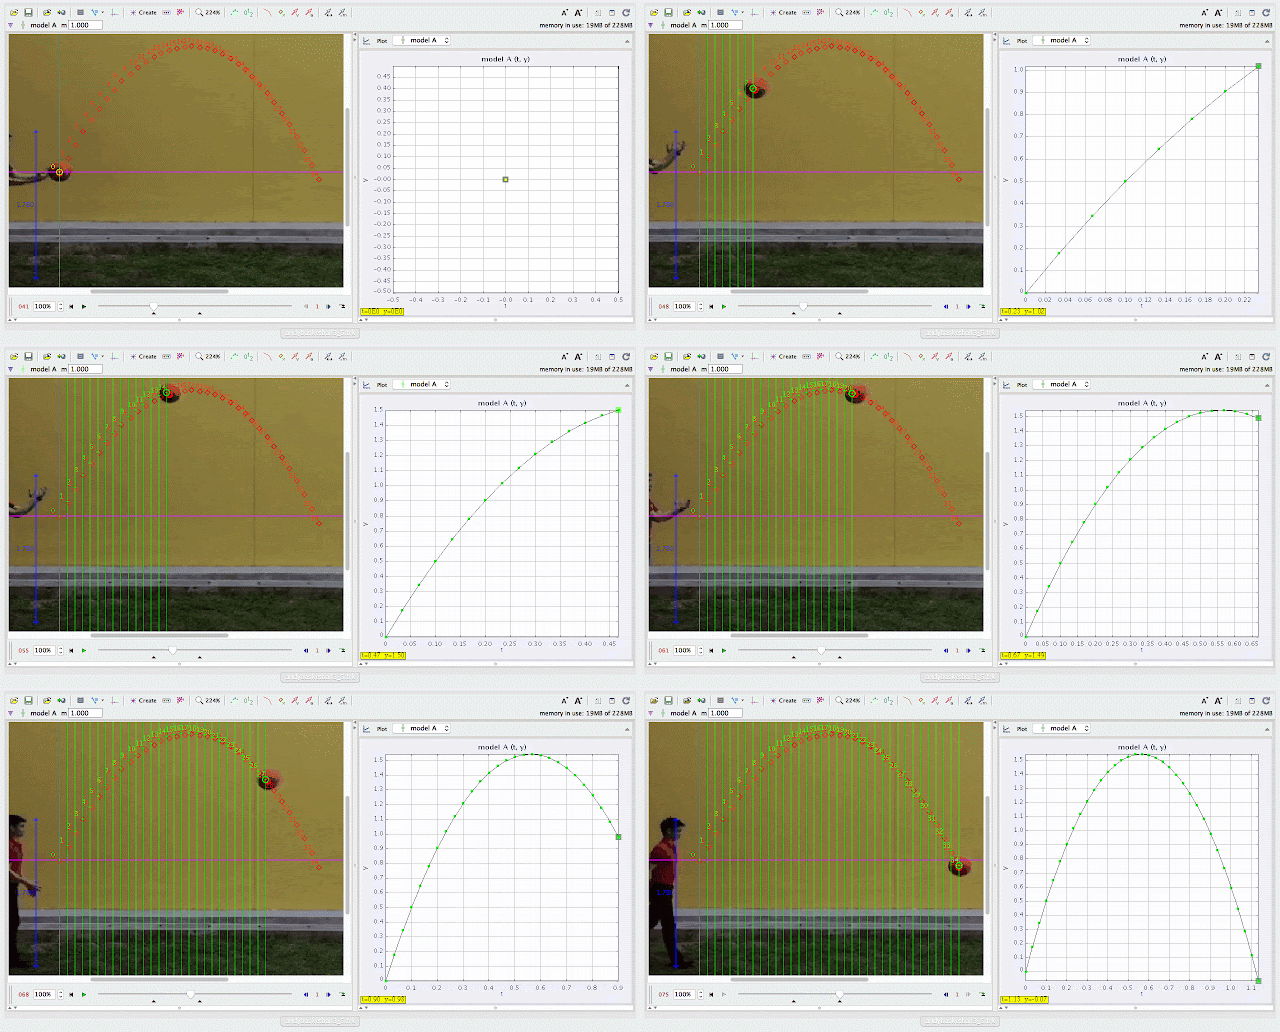
- Displacement vs. Time: Tracks the basketball’s height and horizontal position over time.
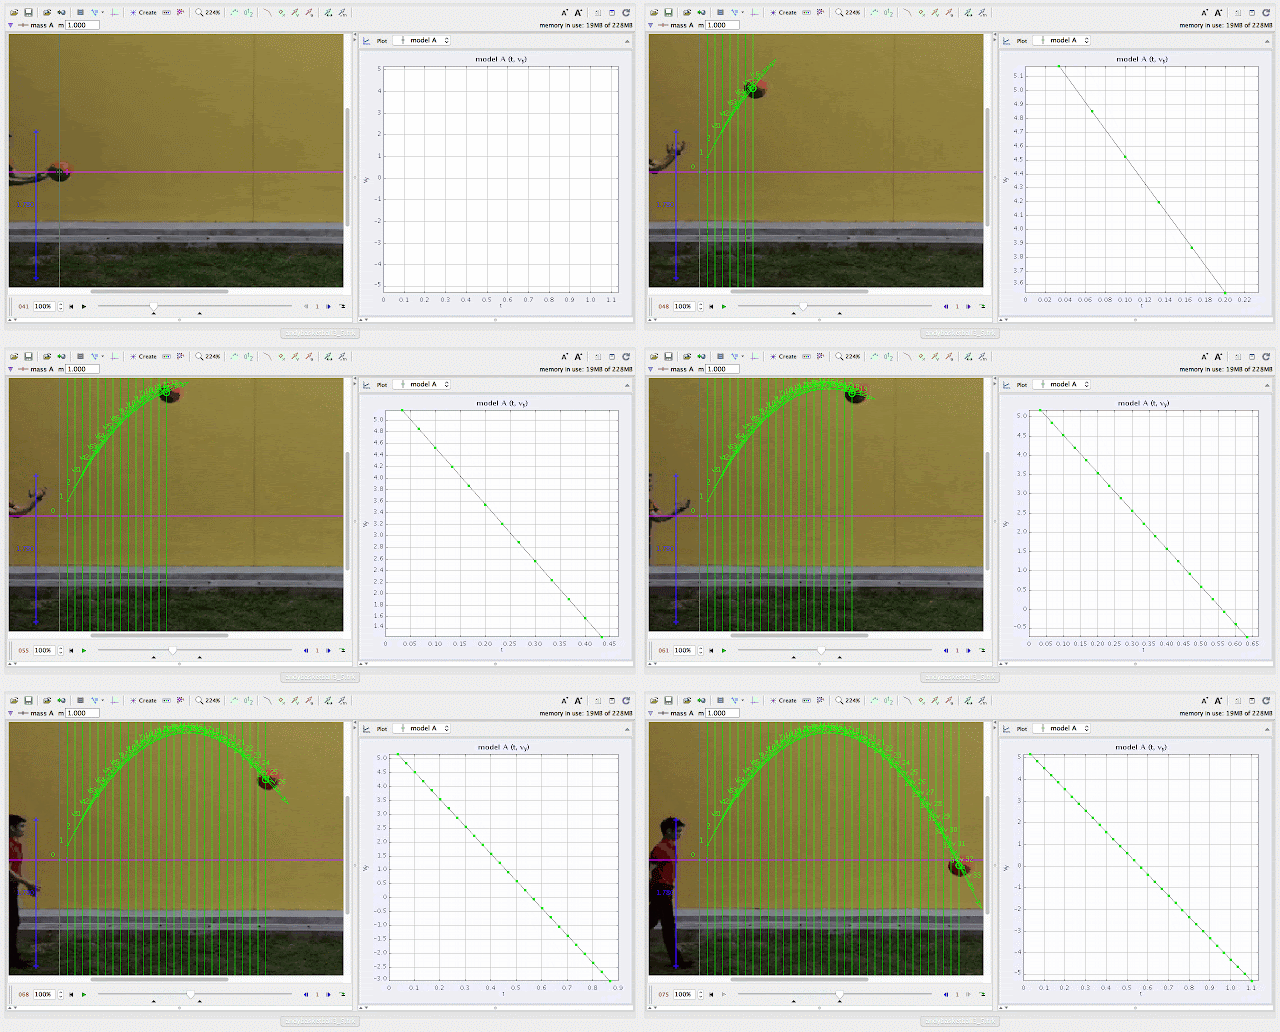
- Velocity vs. Time: Illustrates changes in vertical and horizontal velocity.
- Acceleration vs. Time: Shows constant acceleration due to gravity.
-
Model Builder:
- A tool in Tracker used to create theoretical motion models for comparison with experimental data.
Experiment Overview:
-
Setup:
Record a basketball in motion (e.g., thrown or bounced), ensuring a clear view of its trajectory. -
Procedure:
- Import the video into Tracker and mark key points along the basketball’s path.
- Analyze the motion frame-by-frame to gather position and time data.
- Use Model Builder to construct theoretical motion models.
- Overlay the experimental data with the model for comparison.
- Simplify and present the graphs for educational use.
-
Observation Points:
- Parabolic trajectory in displacement-time graph.
- Linear decay or growth in velocity graphs depending on motion phase.
- Constant negative acceleration due to gravity on the acceleration-time graph.
Questions to Consider:
-
Why is the basketball’s trajectory parabolic?
- Answer: The horizontal motion is uniform, while vertical motion accelerates due to gravity.
-
What does the slope of the velocity-time graph represent?
- Answer: In vertical motion, the slope represents acceleration due to gravity.
-
How can Model Builder help simplify graph interpretation?
- Answer: It provides theoretical trends that clarify patterns in experimental data.
-
What insights can be drawn from discrepancies between experimental and model data?
- Answer: Deviations reveal real-world influences such as air resistance or measurement error.
-
How does the basketball’s motion demonstrate energy principles?
- Answer: It shows the transformation between potential energy and kinetic energy during the trajectory.
Applications:
- Physics Education: Teaches students about projectile motion and data analysis.
- Graphical Skills: Enhances understanding of how graphs reflect physical principles.
- Sports Science: Provides insights into optimizing trajectories in sports.
ICT Connection Lesson
http://library.opal.moe.edu.sg/ictc&func=view&rid=2094
http://library.opal.moe.edu.sg/ictc&func=view&rid=2094
 |
| using Tracker Model Builder to create theoretic graphs for simplifying Physics concepts. projectile motion is illustrated through displacement sy versus time graph |
 |
| using Tracker Model Builder to create theoretic graphs for simplifying Physics concepts. projectile motion is illustrated through velocity vy versus time graph |
 |
| using Tracker Model Builder to create theoretic graphs for simplifying Physics concepts. projectile motion is illustrated through acceleration ay versus time graph |
FAQ:
-
What is the importance of using Model Builder for this study?
- It simplifies data visualization, helping students focus on key motion principles.
-
Can air resistance be included in the model?
- Yes, Model Builder allows the inclusion of drag force to simulate real-world scenarios.
-
What does the flat section of the velocity graph indicate?
- In horizontal motion, it indicates uniform velocity due to the absence of horizontal forces.
-
How does this experiment apply to real-world situations?
- It mirrors real-life projectile motions, such as throwing a basketball or designing sports equipment.
-
What additional factors could be studied using this setup?
- Effects of varying initial velocity, launch angle, or air resistance on motion.
- Details
- Parent Category: 03 Motion & Forces
- Category: 01 Kinematics
- Hits: 7300
