
About
For Teachers
Credits
Author: Yeo Wei Yong Andy and Loo Kang Wee Lawrence
Contact: This email address is being protected from spambots. You need JavaScript enabled to view it.,This email address is being protected from spambots. You need JavaScript enabled to view it.
"Tracker 1/6 Ball Drop: Using Model Builder to Simplify Graphs for Secondary School"
This document introduces a ball-drop experiment modeled and analyzed using Tracker software's Model Builder. The focus is on simplifying the graphical representation of motion, tailored for secondary school students learning foundational kinematics concepts.
Study Guide:
Objective:
- Understand free-fall motion by dropping a ball from a height.
- Use Tracker’s Model Builder to create simplified graphs for educational purposes.
Key Concepts:
-
Free Fall:
- Motion under gravity, assuming negligible air resistance.
-
Displacement, Velocity, and Acceleration:
- Key parameters to observe during the fall.
-
Graphical Representation:
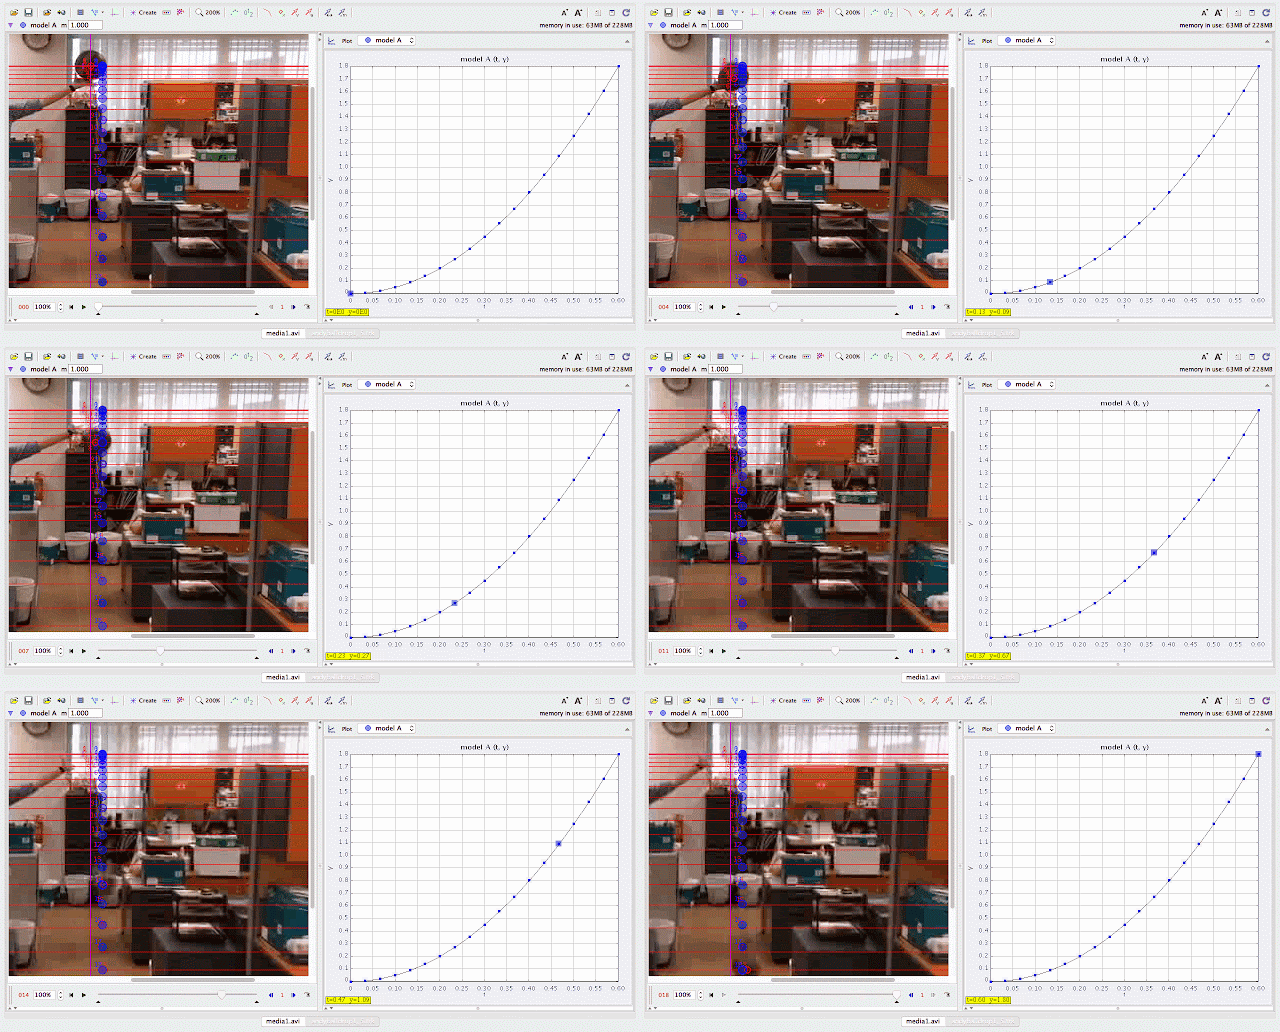
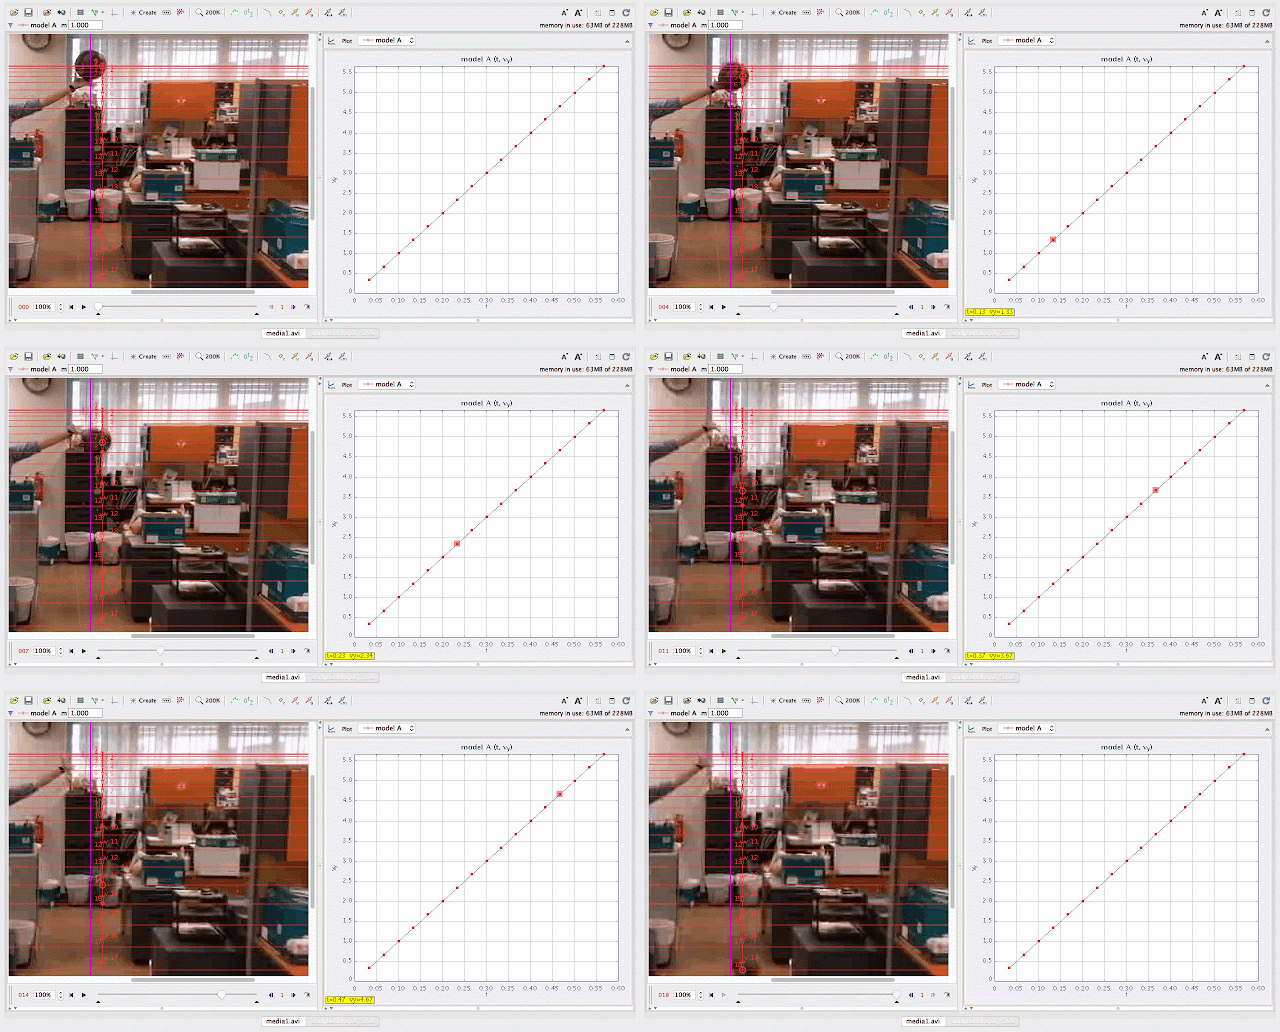
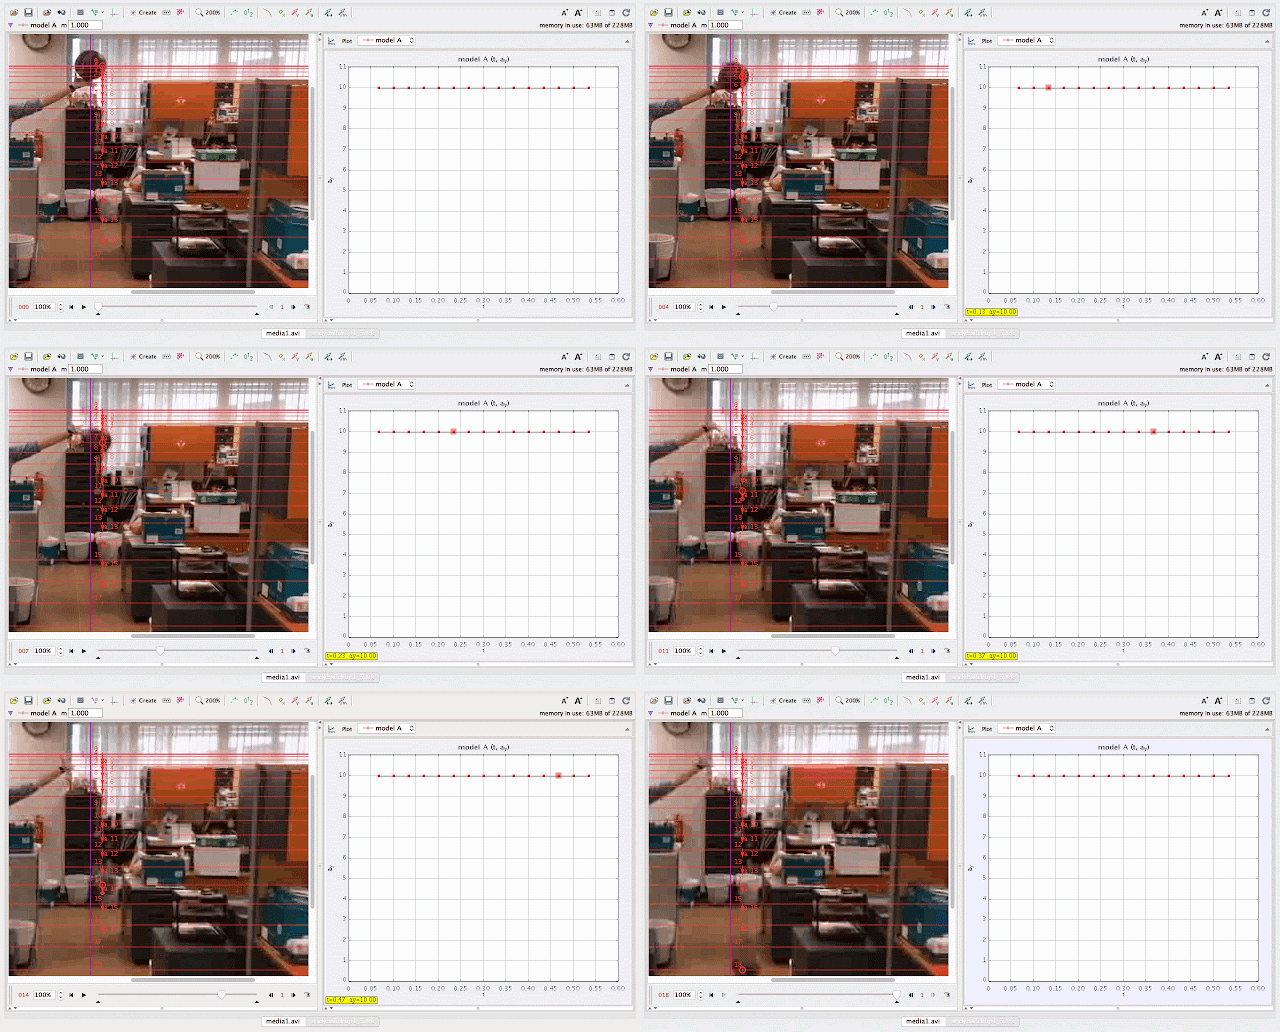
- Simplified graphs of displacement vs. time, velocity vs. time, and acceleration vs. time to illustrate core concepts.
-
Model Builder Tool:
- A Tracker feature for creating theoretical models and comparing them with experimental data.
Experiment Overview:
-
Setup:
A ball is dropped from a known height, and its motion is recorded. The Model Builder in Tracker is used to generate simplified graphs for analysis. -
Procedure:
- Record the motion of the ball using a camera or video device.
- Import the video into Tracker and analyze frame-by-frame motion.
- Use Model Builder to create theoretical motion models.
- Compare the experimental data with the theoretical model.
- Generate simplified graphs for displacement, velocity, and acceleration.
-
Observation Points:
- Acceleration due to gravity (approximately 9.8 m/s29.8 \, \text{m/s}^2).
- Consistent increase in velocity during free fall.
- Linear relationship in displacement vs. time squared.
Questions to Consider:
-
Why does the velocity of the ball increase as it falls?
- Answer: The force of gravity accelerates the ball.
-
What does the slope of the velocity-time graph represent?
- Answer: The slope represents the acceleration due to gravity.
-
How can Model Builder simplify graphs for better understanding?
- Answer: It generates theoretical curves, making deviations and key trends easier to identify.
-
How does the displacement-time graph illustrate free fall?
- Answer: It shows increasing displacement over time, with a quadratic curve due to constant acceleration.
-
Why is the acceleration-time graph constant?
- Answer: The acceleration due to gravity is uniform during free fall.
Applications:
- Education: Helps students visualize and understand the fundamentals of kinematics.
- Graph Analysis: Enhances skills in interpreting and comparing experimental and theoretical data.
- Physics Experiments: Demonstrates practical applications of motion equations.
ICT Connection Lesson
http://library.opal.moe.edu.sg/ictc&func=view&rid=2094
http://library.opal.moe.edu.sg/ictc&func=view&rid=2094
 |
|
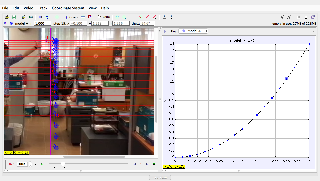
using Tracker Model Builder to create theoretic graphs for simplifying Physics concepts. axes rotated 180 degree for a downward as positive displacement graph. Note that when t = 0.5 s, y = 1.25 m |
FAQ:
-
What is the purpose of using Model Builder?
- To simplify and visualize motion data, making it accessible for students.
-
Can the ball-drop experiment include air resistance?
- Yes, air resistance can be included to show deviations from ideal free fall.
-
What if the experimental data deviates from the model?
- Differences highlight real-world factors like air drag, measurement error, or camera limitations.
-
How does Tracker support secondary school education?
- It provides hands-on tools to explore physics concepts interactively and visually.
-
What are the next steps after graph creation?
- Use the graphs to discuss motion equations, derive relationships, and explore extensions like varying mass or height.
- Details
- Parent Category: 03 Motion & Forces
- Category: 01 Kinematics
- Hits: 8621


