
About
2.3Hydrogen Spectrum
For Teachers
Credits
Author: lee tat leong
Contact: lee_tat_leong@moe.gov.sg

Document Brief: Hydrogen Spectrum Analysis Using Tracker
This document explores the analysis of the hydrogen emission spectrum using Tracker. Hydrogen's spectrum features distinct lines in the visible range (the Balmer series), corresponding to electronic transitions between energy levels. The study aims to measure the wavelengths of these lines and validate them against theoretical predictions derived from quantum mechanics.
Purpose:
To measure and analyze the hydrogen spectral lines using diffraction patterns, validate the Balmer series of transitions, and calculate the Rydberg constant.
Key Features:
- Measurement of hydrogen’s visible spectral lines (Balmer series).
- Validation of experimental data using the Rydberg equation.
- Study of diffraction patterns to analyze quantum transitions.
Study Guide: Hydrogen Spectrum Analysis
Learning Objectives:
- Identify and measure the Balmer series spectral lines in hydrogen's visible spectrum.
- Validate experimental wavelengths using the Rydberg formula.
- Understand the relationship between quantum transitions and spectral lines.
Step-by-Step Guide:
-
Setup and Calibration:
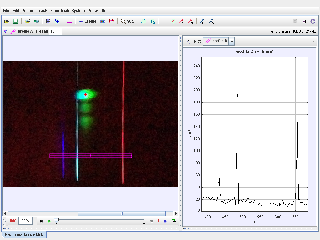
- Import the hydrogen spectrum diffraction pattern into Tracker.
- Calibrate the scale using a known reference (e.g., the distance between the grating and the screen).
-
Identify Balmer Series Lines:
- Track the bright spots corresponding to the visible spectral lines of hydrogen:
- Violet (n = 6 to n = 2): 410.2 nm
- Blue (n = 5 to n = 2): 434.0 nm
- Blue-green (n = 4 to n = 2): 486.1 nm
- Red (n = 3 to n = 2): 656.3 nm
- Track the bright spots corresponding to the visible spectral lines of hydrogen:
-
Apply the Diffraction Equation:
- Use the diffraction grating formula: sinθ=mλ
- d: Grating spacing (d=1/N, where N is the number of lines per meter),
- θ: Angle of diffraction, calculated as tanθ=x/L,
- mm: Diffraction order.
- Use the diffraction grating formula: sinθ=mλ
-
Calculate Wavelengths:
- Rearrange to determine λ=dsinθm
- Measure the wavelengths for each spectral line and compare them to the theoretical values.
-
Validate Using the Rydberg Formula:
- The Balmer series wavelengths are given by: 1λ=R(122−1n2)
- R=1.097×10⁷ m−1: Rydberg constant,
- n=3,4,5,: Principal quantum number of the upper level.
- The Balmer series wavelengths are given by: 1λ=R(122−1n2)
-
Graphical Analysis:
- Plot the inverse wavelengths (1/λ) against 1/n2 to validate the linear relationship predicted by the Rydberg formula.
- Determine the Rydberg constant from the slope of the graph.
-
Applications:
- Study hydrogen’s atomic structure and its energy levels.
- Validate quantum mechanical predictions for atomic transitions.
Tips for Success:
- Ensure accurate calibration for precise measurements of diffraction angles.
- Use higher diffraction orders (m>1) to improve accuracy.
FAQ: Hydrogen Spectrum Analysis
1. What is the hydrogen emission spectrum?
The hydrogen emission spectrum consists of distinct spectral lines produced when electrons in hydrogen atoms transition from higher energy levels to lower ones. The Balmer series corresponds to transitions to the n=2 energy level.
2. What are the visible spectral lines in hydrogen?
The Balmer series includes:
- Violet (410.2 nm): n=6→2
- Blue (434.0 nm): n=5→2
- Blue-green (486.1 nm): n=4→2
- Red (656.3 nm): n=3→2
3. How are these wavelengths measured?
Tracker software is used to track the diffraction maxima for each spectral line. The wavelengths are calculated using the diffraction grating equation:
λ=dsinθm
4. How is the Rydberg formula used in this analysis?
The Rydberg formula relates the wavelengths of the Balmer series to quantum transitions in hydrogen:
1λ=R(122−1n2)
This allows validation of the measured wavelengths and calculation of the Rydberg constant.
5. Why is the Rydberg constant important?
The Rydberg constant (R) is a fundamental physical constant that describes the wavelengths of spectral lines in hydrogen. It is crucial for validating quantum mechanics and atomic physics.
6. What are the practical applications of this model?
- Understanding hydrogen’s atomic structure.
- Analyzing stellar spectra in astrophysics.
- Studying the principles of quantum transitions and spectroscopy.
7. What are common sources of error?
- Misalignment of the diffraction grating or calibration issues.
- Inaccurate identification of spectral lines due to overlapping or faint spots.
8. How can this analysis be extended?
This study can be extended to:
- Analyze other spectral series in hydrogen (e.g., Lyman or Paschen).
- Study Doppler shifts in hydrogen lines due to motion in astronomical objects.
