
About
For Teachers
Credits
Author: tatlee08@gmail.com
Contact: tatlee08@gmail.com

Document Brief: Helium Emission Spectrum Analysis Using Tracker
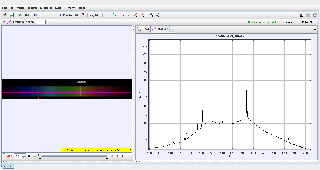
This document examines the helium emission spectrum using Tracker software. Helium's spectral lines result from electronic transitions within the helium atom, and they are observed as distinct wavelengths in the visible light region. The study validates the measured helium lines against theoretical values by analyzing diffraction patterns.
Purpose:
To analyze the helium spectral lines, measure their wavelengths using diffraction patterns, and compare the results with theoretical predictions to validate the properties of helium's emission spectrum.
Key Features:
- Measurement of helium’s spectral lines in the visible spectrum.
- Validation of experimental data with theoretical predictions.
- Study of diffraction patterns generated by helium’s emission spectrum.
Study Guide: Helium Emission Spectrum Analysis
Learning Objectives:
- Identify and measure the spectral lines of helium in the visible spectrum.
- Understand how diffraction patterns reveal helium’s atomic structure.
- Validate experimental wavelength measurements against theoretical values.
Step-by-Step Guide:
-
Setup and Calibration:
- Import the helium spectrum diffraction pattern into Tracker.
- Calibrate the scale using a known reference distance, such as the grating-to-screen distance.
-
Identify Helium Spectral Lines:
- Track the positions of bright spots corresponding to helium’s spectral lines:
- Violet: 388.8 nm
- Blue: 447.1 nm
- Green: 501.6 nm
- Yellow: 587.6 nm
- Red: 667.8 nm
- Track the positions of bright spots corresponding to helium’s spectral lines:
-
Apply the Diffraction Equation:
- Use the diffraction grating formula: dsinθ=mλ
- d: Grating spacing (d=1/N, where N is the number of slits per meter),
- θ: Angle of diffraction, calculated as tanθ=x/L,
- mm: Diffraction order.
- Use the diffraction grating formula: dsinθ=mλ
-
Calculate Wavelengths:
- Rearrange the equation to determine λ: λ=dsinθm
- Measure the wavelengths for each spectral line and compare them with theoretical values.
-
Graphical Analysis:
- Plot the wavelengths (λ) vs. their respective positions.
- Compare the measured helium lines with their theoretical counterparts to validate the model.
-
Applications:
- Study the atomic structure of helium through its emission spectrum.
- Understand the relationship between energy levels and spectral lines.
Tips for Success:
- Track bright spots carefully to ensure accurate measurements.
- Use higher diffraction orders (mm) to improve precision in wavelength calculations.
FAQ: Helium Emission Spectrum Analysis
1. What is the helium emission spectrum?
The helium emission spectrum consists of specific wavelengths of light emitted by helium atoms when their electrons transition between energy levels. These wavelengths correspond to unique spectral lines.
2. What are the visible spectral lines for helium?
- Violet: 388.8 nm
- Blue: 447.1 nm
- Green: 501.6 nm
- Yellow: 587.6 nm
- Red: 667.8 nm
3. How are these wavelengths measured?
The positions of the diffraction maxima for each spectral line are tracked using Tracker. The wavelengths are calculated using the diffraction grating equation:
λ=dsinθm
4. How does the diffraction grating work?
The diffraction grating splits light into its constituent wavelengths. The angle of diffraction (θ\theta) is dependent on the wavelength (λ) and the grating spacing (d).
5. Why is helium’s spectrum important?
Helium’s spectrum is essential in:
- Studying atomic energy levels.
- Astrophysical observations (e.g., analyzing helium in stellar spectra).
- Spectroscopy techniques in physics and chemistry.
6. What are the practical applications of this model?
- Understanding the behavior of light in optical systems.
- Studying atomic structures and energy transitions.
- Identifying elements in astronomical spectroscopy.
7. What factors affect measurement accuracy?
- Calibration errors in Tracker.
- Misalignment of the diffraction grating or screen.
- Incorrect identification of spectral lines.
8. Can this analysis be extended?
Yes, it can be extended to study:
- Doppler shifts in helium lines due to motion.
- Broader spectroscopic features in multi-element systems.
