
About
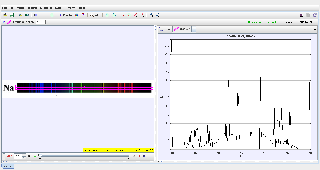
solarspectrum2.1Na by Tat Leong
For Teachers
- solarspectrum11.png
- solarspectrum10.png
- solarspectrum09.png
- solarspectrum08.png
- solarspectrum07.png
- solarspectrum06.png
- solarspectrum05.png
- solarspectrum04.png
- solarspectrum03.png
- solarspectrum02.png
Credits
Author: tatlee08@gmail.com

Document Brief: Solar Spectrum 2.1Na (Sodium) Analysis Using Tracker
This document analyzes the sodium emission spectrum from sunlight using Tracker. The sodium spectrum is characterized by its distinct doublet lines (589.0 nm and 589.6 nm), which arise from atomic transitions in sodium. The study validates the measured wavelengths of these spectral lines and compares them to theoretical values.
Purpose:
To study the sodium doublet in the solar spectrum, measure its wavelengths using diffraction patterns, and validate experimental findings with theoretical predictions.
Key Features:
- Measurement of sodium’s spectral lines in sunlight (589.0 nm and 589.6 nm).
- Analysis of diffraction patterns and calculation of wavelengths.
- Validation of the atomic transition characteristics of sodium.
Study Guide: Sodium Emission Spectrum Analysis
Learning Objectives:
- Identify and measure the sodium doublet lines (λ=589.0 nm).
- Understand how diffraction gratings separate spectral lines.
- Compare experimental results with theoretical predictions.
Step-by-Step Guide:
-
Setup and Calibration:
- Import the sodium spectrum diffraction pattern into Tracker.
- Calibrate the scale using a known reference distance in the experimental setup (e.g., grating-to-screen distance or scale markings).
-
Identify Sodium Doublet Peaks:
- Track the bright spots corresponding to the sodium doublet lines (λ1=589.0 nm, λ2=589.6 nm).
- Measure their positions relative to the central maximum.
-
Apply the Diffraction Equation:
- Use the diffraction grating equation: dsinθ=mλd \sin\theta = m\lambda
- dd: Spacing between grating slits (d=1/N, where N is the number of lines per meter),
- θ\theta: Diffraction angle (tanθ=x/L),
- mm: Diffraction order.
- Use the diffraction grating equation: dsinθ=mλd \sin\theta = m\lambda
-
Calculate Wavelengths:
- Rearrange the equation to determine λ: λ=(dsinθ)/m
- Perform measurements for both sodium lines (λ1,λ2) and verify their separation.
-
Graphical Analysis:
- Plot the intensity vs. position or wavelength for the sodium lines.
- Highlight the separation of the doublet and compare with the theoretical difference (Δλ=0.6 nm).
-
Applications:
- Validate the atomic transitions responsible for sodium’s spectral lines.
- Study the Doppler shift effects in the solar spectrum for advanced applications.
Tips for Success:
- Ensure precise alignment and tracking of the sodium lines in Tracker.
- Use higher diffraction orders (m>1) to improve measurement accuracy.
FAQ: Sodium Emission Spectrum Analysis
1. What is the sodium doublet?
The sodium doublet consists of two closely spaced spectral lines at λ1=589.0 nm and λ2=589.6 nm. These arise from transitions in the sodium atom.
2. How are the wavelengths of the doublet measured?
The positions of the diffraction maxima corresponding to the sodium doublet are tracked using Tracker. The wavelengths are calculated using the diffraction grating equation:
λ=dsinθm
3. What does the separation (Δλ) of the doublet represent?
The separation Δλ=λ2−λ1=0.6 nm represents the energy difference between the two transitions in sodium’s atomic structure.
4. How is the diffraction grating involved in this analysis?
The grating splits the light into its constituent wavelengths. The diffraction pattern allows precise measurement of the sodium lines based on their angles of diffraction.
5. What are the practical applications of this model?
- Studying atomic transitions and emission spectra.
- Analyzing stellar spectra for sodium absorption lines.
- Understanding spectral line broadening and Doppler shifts in astrophysics.
6. Can this analysis detect Doppler shifts?
Yes, by comparing the measured wavelengths to the standard values (589.0 nm and 589.6 nm), Doppler shifts can be identified.
7. What are common sources of error in this experiment?
- Misalignment of the grating or screen.
- Errors in calibrating the scale or measuring diffraction angles.
