
About
solarspectrum by lee tat leong
For Teachers
- solarspectrum09.png
- solarspectrum08.png
- solarspectrum07.png
- solarspectrum06.png
- solarspectrum05.png
- solarspectrum04.png
- solarspectrum03.png
- solarspectrum02.png
- solarspectrum01.png
- solarspectrum00.png
- solar spectrum.png
- Solar_Spectrum.png
- Analysing Solar spectrum.pdf
- Analysing Solar spectrum.doc
- Analysing Solar spectrum soln.pdf
Credits
Author: lee tat leong
Contact: tatlee08@gmail.com

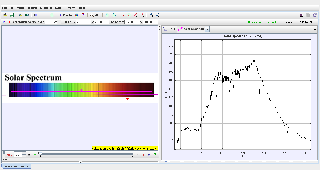
Document Brief: Analyzing Solar Spectrum Using Tracker
This document explores the analysis of the solar spectrum captured from a diffraction grating experiment. Using Tracker software, the wavelengths of different colors in the visible spectrum are measured and correlated with theoretical predictions to analyze the diffraction pattern of sunlight.
Purpose:
To study the visible solar spectrum using diffraction patterns, measure the wavelengths of various colors, and compare experimental data with theoretical values.
Key Features:
- Analysis of the solar spectrum using diffraction grating.
- Measurement of wavelengths for different colors in the visible spectrum.
- Validation of diffraction equations and wavelength predictions.
Study Guide: Solar Spectrum Analysis Using Tracker
Learning Objectives:
- Understand the formation of a diffraction pattern from sunlight using a diffraction grating.
- Measure the wavelengths of visible light using Tracker tools.
- Validate theoretical predictions for the solar spectrum.
Step-by-Step Guide:
-
Setup and Calibration:
- Import the diffraction pattern image of the solar spectrum into Tracker.
- Calibrate the scale using a known distance on the setup, such as the grating-to-screen distance or reference markers.
-
Identify Diffraction Peaks:
- Track the positions of the bright spots for each color in the diffraction pattern.
- Measure the distances (x) of these peaks from the central maximum.
-
Apply the Diffraction Equation:
- Use the diffraction grating equation: dsinθ=mλ where:
- dd: Spacing between adjacent slits in the grating (d=1/N), where is the number of slits per meter),
- : Angle of diffraction, calculated as tanθ=x/L,
- mm: Order of diffraction (e.g., m=1,2,),
- λ\lambda: Wavelength of the light.
- Use the diffraction grating equation: dsinθ=mλ where:
-
Calculate Wavelengths:
- Rearrange the diffraction equation to calculate λ: λ=(dsinθ)/m
- Repeat for different colors in the spectrum to find their corresponding wavelengths.
-
Graphical Analysis:
- Plot the wavelength (λ) against the observed colors (e.g., violet, blue, green, yellow, red).
- Compare experimental values with theoretical ranges for visible light (400–700 nm).
-
Applications:
- Validate the wavelength ranges of visible light.
- Study the solar spectrum and its intensity distribution across different wavelengths.
Tips for Success:
- Ensure accurate calibration to minimize errors in θ and λ
- Use multiple diffraction orders (m=1,2,3) to improve measurement reliability.
FAQ: Solar Spectrum Analysis
1. How is the solar spectrum formed?
The solar spectrum is formed when sunlight passes through a diffraction grating, which splits the light into its constituent colors based on their wavelengths.
2. What does the diffraction grating equation describe?
The diffraction grating equation relates the angle of diffraction (θ) to the wavelength () of light:
dsinθ=mλd
3. How are wavelengths measured using Tracker?
Wavelengths are measured by tracking the positions of bright spots (diffraction maxima) on the screen, calculating θ\theta based on their positions relative to the central maximum, and applying the diffraction equation.
4. What is the role of the grating spacing (dd)?
The grating spacing (d=1/) determines the diffraction angle for a given wavelength. A smaller dd (higher N) results in larger diffraction angles.
5. What are the theoretical ranges for visible light?
- Violet: 380–450 nm
- Blue: 450–495 nm
- Green: 495–570 nm
- Yellow: 570–590 nm
- Orange: 590–620 nm
- Red: 620–750 nm
6. What are the practical applications of this analysis?
- Analyzing the spectral composition of light sources.
- Validating the principles of diffraction and interference.
- Studying the absorption features in the solar spectrum for astronomical research.
7. How can errors be minimized in this analysis?
- Use high-precision calibration for distance and angles.
- Repeat measurements for multiple diffraction orders (mm) and average the results.
