
About
For Teachers
Credits
Author: Andy check out task, Lawrence Model
Contact: yeo_wei_yong_andy@moe.edu.sg
Title: "Tracker 6/6 Check-Out Task: Using Model Builder to Simplify Graphs for Secondary School"
This document provides a structured check-out task for students using Tracker's Model Builder to analyze motion and create simplified graphs. The goal is to consolidate learning and assess understanding of kinematic principles through practical application.
Study Guide:
Objective:
- Utilize Tracker and Model Builder to analyze motion.
- Simplify experimental data into key graphs to reinforce kinematics concepts.
Key Concepts:
-
Graphical Analysis:
- Interpret displacement, velocity, and acceleration data to understand motion trends.
-
Model Validation:
- Compare theoretical and experimental data for consistency and identify discrepancies.
-
Critical Thinking:
- Evaluate assumptions, data accuracy, and real-world applications.
Task Overview:
-
Setup:
Students work with pre-recorded motion videos or conduct simple experiments, such as tracking a ball, car, or toy's motion. -
Procedure:
- Import the motion video into Tracker.
- Analyze the object's position frame by frame.
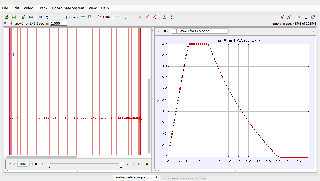
- Generate displacement, velocity, and acceleration graphs.
- Use Model Builder to create theoretical models matching the observed data.
- Overlay experimental and theoretical graphs for comparison.
- Simplify the graphs for classroom presentation.
-
Expected Outputs:
- A set of clear and labeled graphs (Displacement vs. Time, Velocity vs. Time, and Acceleration vs. Time).
- A comparison of theoretical and experimental data with commentary on discrepancies.
Questions to Consider:
-
How does the displacement graph reflect the motion observed?
- Answer: It shows the total distance covered over time, with trends depending on speed changes.
-
What does the velocity graph reveal about the object's motion?
- Answer: Whether the object’s motion is uniform, accelerating, or decelerating.
-
How consistent is the experimental data with the theoretical model?
- Answer: Minor deviations may arise from measurement inaccuracies or unmodeled forces.
-
What assumptions are made in the theoretical model?
- Answer: Uniform motion laws, neglect of air resistance, or idealized initial conditions.
-
How can the graphs be simplified for better understanding?
- Answer: Use clean labels, focus on key points, and eliminate noise or unnecessary data.
Applications:
- Classroom Assessment: Evaluate student comprehension of motion concepts.
- Practical Skills: Develop proficiency in using Tracker and Model Builder.
- Critical Thinking: Encourage analysis of data quality and assumptions.
ICT Connection Lesson
http://library.opal.moe.edu.sg/ictc&func=view&rid=2094
http://library.opal.moe.edu.sg/ictc&func=view&rid=2094
FAQ:
-
What is the purpose of this task?
- To synthesize learning, practice analytical skills, and simplify complex motion data.
-
What tools are required?
- Tracker software with Model Builder, a video of motion, and a computer.
-
How do students validate their graphs?
- By comparing experimental data with theoretical predictions and discussing discrepancies.
-
Can this task be adapted for group work?
- Yes, students can collaborate on data collection, analysis, and graph simplification.
-
What skills does this task reinforce?
- Data interpretation, modeling, teamwork, and presentation.
- Details
- Parent Category: 03 Motion & Forces
- Category: 01 Kinematics
- Hits: 5604

