
About
Uniform Deceleration Toy Car by Andy Yeo
For Teachers
Credits
Author: Yeo Wei Yong Andy video, Loo Kang Model
Contact: yeo_wei_yong_andy@moe.edu.sg
Title: "Tracker 2/6 Decelerating Toy Car: Using Model Builder to Simplify Graphs for Secondary School"
This document analyzes the motion of a decelerating toy car using Tracker software and its Model Builder tool. It emphasizes simplifying graphical representations to teach secondary school students the fundamentals of kinematics, including deceleration and velocity changes over time.
Study Guide:
Objective:
- Examine the motion of a toy car decelerating over time.
- Use Model Builder to generate simplified graphs for educational purposes.
Key Concepts:
-
Deceleration:
- A decrease in velocity over time due to opposing forces like friction or braking.
-
Key Graphs:
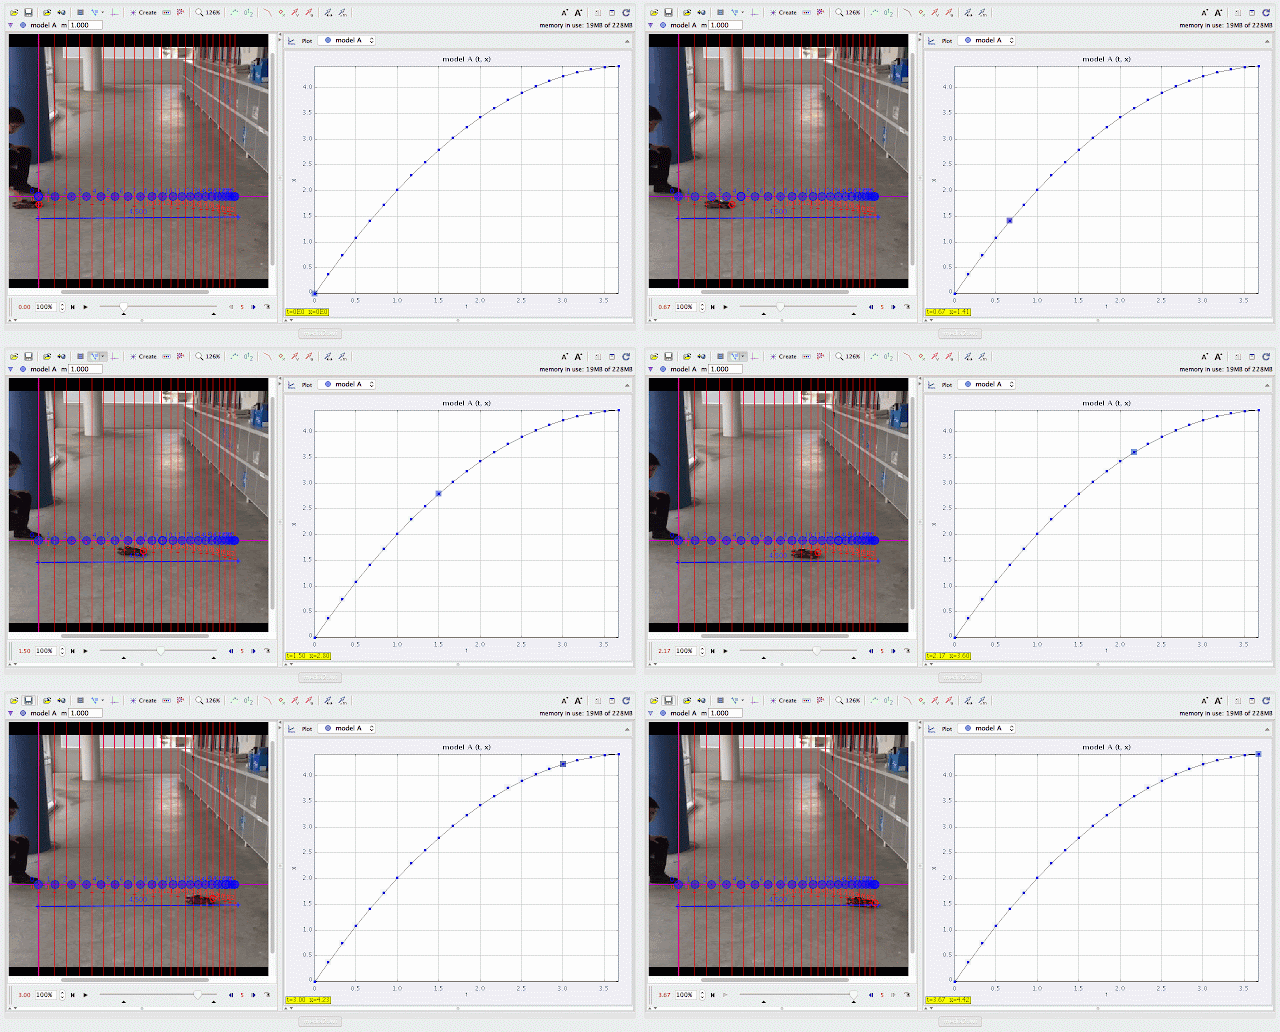
- Displacement vs. Time: A curve showing a gradual reduction in distance traveled.
- Velocity vs. Time: A downward-sloping line indicating decreasing velocity.
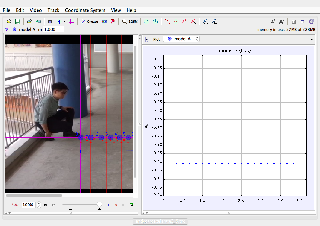
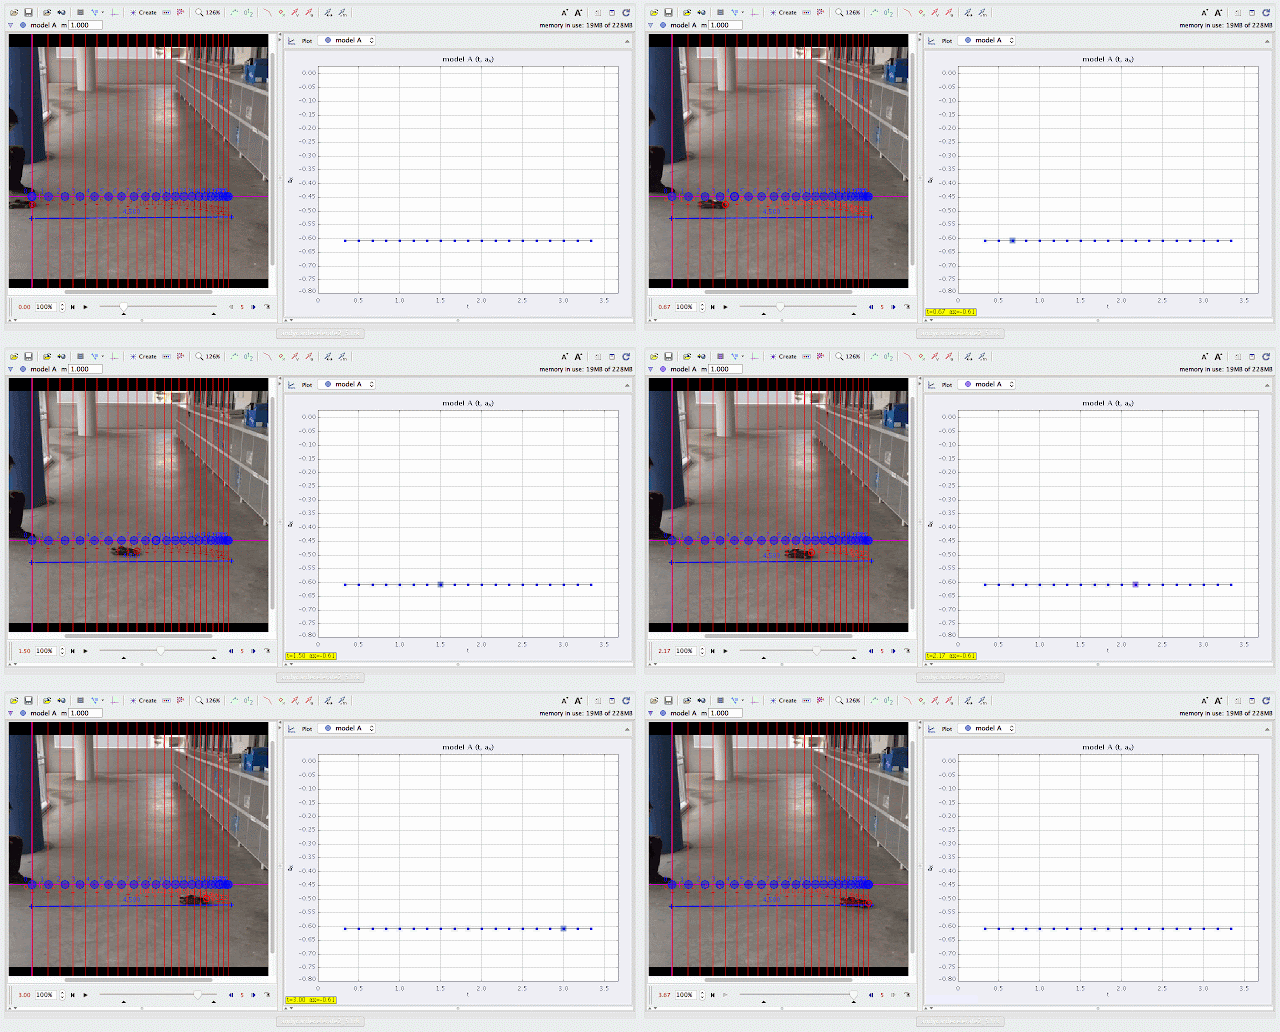
- Acceleration vs. Time: A horizontal line below zero for constant deceleration.
-
Model Builder:
- A Tracker feature that creates theoretical motion models for comparison with real data.
Experiment Overview:
-
Setup:
Record a toy car decelerating as it moves on a flat surface, ensuring consistent lighting and a clear view. -
Procedure:
- Import the video into Tracker and mark the car’s position frame by frame.
- Extract data for displacement, velocity, and acceleration over time.
- Use Model Builder to construct a theoretical motion model with uniform deceleration.
- Overlay the experimental data with the model to identify patterns.
- Simplify the graphs for classroom use.
-
Observation Points:
- The displacement graph flattens as the car slows down.
- The velocity graph shows a straight line sloping downward.
- The acceleration graph remains constant at a negative value.
Questions to Consider:
-
What causes the toy car to decelerate?
- Answer: Friction, air resistance, or braking forces reduce its velocity.
-
How does the velocity graph indicate deceleration?
- Answer: The negative slope shows a decrease in velocity over time.
-
What does the shape of the displacement graph signify?
- Answer: The car covers less distance as it slows down, reflected by the curve flattening.
-
How does Model Builder help students understand motion?
- Answer: It provides theoretical benchmarks that clarify observed motion trends.
-
What can we learn from differences between experimental and theoretical data?
- Answer: Variations may highlight real-world factors like surface irregularities or measurement inaccuracies.
Applications:
- Physics Education: Teaches kinematic principles using relatable, real-world examples.
- Graphical Skills: Enhances ability to interpret and simplify motion graphs.
- Practical Insights: Provides foundational knowledge for understanding vehicle braking systems and safety.
ICT Connection Lesson
http://library.opal.moe.edu.sg/ictc&func=view&rid=2094
http://library.opal.moe.edu.sg/ictc&func=view&rid=2094
 |
| using Tracker Model Builder to create theoretic graphs for simplifying Physics concepts. concept illustrated is uniform deceleration displacement graph |
 |
| using Tracker Model Builder to create theoretic graphs for simplifying Physics concepts. constant deceleration is illustrated through straight line of velocity versus time graph |
 |
| using Tracker Model Builder to create theoretic graphs for simplifying Physics concepts. constant deceleration is illustrated through horizontal straight line of acceleration versus time graph |
FAQ:
-
Why is the velocity graph a straight line?
- A constant deceleration results in a linear decrease in velocity.
-
What does the constant value in the acceleration graph represent?
- The magnitude of the opposing force slowing the car.
-
How does Model Builder handle non-uniform deceleration?
- It can accommodate varying deceleration rates to reflect more complex scenarios.
-
What factors might affect the toy car’s deceleration?
- Surface roughness, wheel resistance, or additional applied forces.
-
How can this study be expanded for advanced learners?
- Introduce non-linear deceleration, study energy dissipation, or include different toy car models for comparison.
- Details
- Parent Category: 03 Motion & Forces
- Category: 01 Kinematics
- Hits: 6640
