


About
Topics
Scalars and vectorsMeasurement of length and time
Description
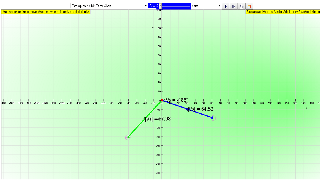
Play with the vector sum Model. The simulation randomly generates different vector A and B every time the reset is clicked.You can
drag the vector midpoint to re-position
drag the vector head to re-size
There are also 3 examples of how this simulation can be used by Teacher Mr. Ezzy Chan.
There are also 3 components representation to connect with the related simulation on components of a vector.
Challenge:
Take an example from your usual word problem and take a picture of it and try to use the simulation to represent the word problem. After you are done, the simulation should be able to calculate as well as draw the resultant vector. send your completed picture to This email address is being protected from spambots. You need JavaScript enabled to view it. to be included as an example in this simulation-model!Sample Learning Goals
(f) add two vectors to determine a resultant by a graphical method(b) solve problems for a static point mass under the action of 3 forces for 2-dimensional cases (a graphical method would suffice)
Version:
- http://weelookang.blogspot.sg/2015/07/ejss-vector-sum-model.html
- http://weelookang.blogspot.sg/2010/06/add-two-vectors-to-determine-resultant.html
- http://www.phy.ntnu.edu.tw/ntnujava/index.php?topic=216.msg846#msg846
Translations
| Code | Language | Translator | Run | |
|---|---|---|---|---|
 |
||||
Credits

wee loo kang; tina
- Main Theme: This source directly addresses the concept of scalars and vectors and focuses specifically on the graphical method for vector addition.
- Important Ideas/Facts:The title clearly indicates the content will cover the distinction between scalars and vectors and how to add vectors using graphical techniques.
- The attribution indicates the authors are wee loo kang and tina, and the resource was compiled using EJS 6.0 (Easy JavaScript Simulations).
- The Creative Commons license suggests the material is intended for sharing and adaptation under certain conditions.
Source 2: "Student Learning Space Vector Addition by Graphical Method JavaScript HTML5 Applet Simulation Model - Open Educational Resources / Open Source Physics @ Singapore | Open Educational Resources / Open Source Physics @ Singapore"
- Main Theme: This source introduces an interactive simulation model designed to help students learn and understand vector addition through a graphical interface. It emphasizes hands-on exploration and connection to real-world problems.
- Important Ideas/Facts:Interactive Simulation: The core of this resource is a JavaScript HTML5 applet simulation that allows users to manipulate vectors A and B and observe their resultant. The description highlights the interactive features: users can "drag the vector midpoint to re-position" and "drag the vector head to re-size."
- Random Vector Generation: The simulation "randomly generates different vector A and B every time the reset is clicked," providing varied practice opportunities.
- Learning Objectives: The resource explicitly states learning goals, including "(f) add two vectors to determine a resultant by a graphical method" and "(b) solve problems for a static point mass under the action of 3 forces for 2-dimensional cases (a graphical method would suffice)." This aligns directly with curriculum objectives.
- Teacher Support: The inclusion of "3 examples of how this simulation can be used by Teacher Mr. Ezzy Chan" and a dedicated "For Teacher" section with a "Lesson Example" suggests that this resource is designed to be integrated into classroom teaching.
- Challenge-Based Learning: The "Challenge" section encourages students to connect the simulation to real-world problems by taking a picture of a word problem and representing it in the simulation. This promotes deeper understanding and application of the concept. The request to send completed pictures to an email address indicates a desire to build a library of examples.
- Connections to Other Resources: The description mentions "3 components representation to connect with the related simulation on components of a vector," indicating a broader suite of learning materials. The inclusion of numerous links under "Versions" and "Other Resources" points to related simulations and explanations of vector addition and related physics concepts. These links include resources from the National Taiwan Normal University (NTNU) and oPhysics.com.
- Open Educational Resources: The title and the mention of a Creative Commons license (implicitly linked to the OER context) indicate that this resource is intended to be freely accessible and usable.
- Accessibility: The mention of "Android/iOS including handphones/Tablets/iPads" and "Windows/MacOSX/Linux including Laptops/Desktops" highlights the cross-platform compatibility of the HTML5 applet.
- Curriculum Alignment: The "Learning Outcomes: H2 - 1(h)(i)(j)" and the link to the Singaporean A-Level Physics curriculum further emphasize the resource's relevance for specific educational standards.
- Emphasis on "Ways of Thinking and Doing (WOTD)": The link provided for WOTD suggests that the simulation encourages specific scientific inquiry skills.
- Translations: The availability of translations indicates an effort to broaden the accessibility of the resource.
- Credits: The credits acknowledge wee loo kang and tina, consistent with the author attribution in the first source, suggesting a connection between the creators.
Overall Themes and Connections:
- Both sources focus on the teaching and learning of vector addition.
- The second source provides a practical, interactive tool (the simulation) that directly supports the theoretical concepts likely discussed in the first source (though the full content of the first source is not provided).
- The emphasis on graphical methods in both titles highlights a visual and geometric approach to understanding vector addition.
- The use of EJS (Easy JavaScript Simulations) as mentioned in the first source and the description of the second source as a "JavaScript HTML5 Applet Simulation Model" indicates the technology underpinning these resources.
- The Open Educational Resources / Open Source Physics @ Singapore context underscores a commitment to freely available and modifiable educational materials.
Key Takeaways:
- The provided materials highlight the use of interactive simulations as a valuable tool for teaching vector addition using graphical methods.
- The simulation described offers features that promote active learning, experimentation, and the connection of abstract concepts to real-world scenarios.
- The resources are designed with both students and teachers in mind, offering learning objectives, examples, and potential integration into existing curricula.
- The open nature of these resources allows for wider accessibility and potential adaptation by educators.
This briefing provides a foundational understanding of the resources provided. Further examination of the full text of "Scalars and Vectors: Vector Addition by Graphical Method" and direct interaction with the simulation would offer a more comprehensive understanding
Scalars and Vectors: Graphical Addition Study Guide
Quiz
- Define a scalar quantity and provide two examples from everyday life. How does a scalar quantity differ from a vector quantity?
- What is a vector quantity? Describe two key characteristics that define a vector, and give two examples of vector quantities.
- Explain the graphical method of vector addition using the head-to-tail method. Describe the steps involved in adding two vectors, A and B, using this method.
- How is the resultant vector determined when adding two or more vectors graphically? What does the resultant vector represent?
- Briefly describe the parallelogram method of vector addition. In what situations might the parallelogram method be more convenient than the head-to-tail method?
- What is the significance of the length of the arrow representing a vector in a graphical representation? What determines the direction of the vector?
- Explain how the simulation tool described in the source material allows for the manipulation and addition of vectors. What actions can a user perform with the vectors in the simulation?
- According to the "Challenge" section, how can the simulation be used to solve real-world word problems involving vectors? What steps are suggested?
- What are some of the learning goals associated with using the vector addition simulation? Provide at least two learning goals mentioned in the text.
- How can graphical vector addition be applied to solve problems involving static equilibrium under the action of multiple forces? Explain the concept of equilibrium in this context.
Quiz Answer Key
- A scalar quantity is a physical quantity that has only magnitude (size or amount) and no direction. Examples include temperature, mass, and time. Unlike scalars, vector quantities possess both magnitude and direction.
- A vector quantity is a physical quantity that has both magnitude and direction. Key characteristics are its numerical value (magnitude) and the orientation in space (direction). Examples include velocity, force, and displacement.
- The head-to-tail method involves placing the tail (starting point) of the second vector at the head (ending point) of the first vector. The resultant vector is then drawn from the tail of the first vector to the head of the second vector.
- The resultant vector is represented by an arrow drawn from the starting point of the first vector in the series to the ending point of the last vector. It represents the single vector that has the same effect as all the individual vectors acting together.
- The parallelogram method involves placing the tails of the two vectors at the same point. A parallelogram is then constructed with these two vectors as adjacent sides. The resultant vector is the diagonal of the parallelogram drawn from the common tail. This method is convenient when the tails of the vectors naturally originate from the same point.
- The length of the arrow representing a vector is proportional to the magnitude of the vector, often to a chosen scale. The direction of the vector is indicated by the orientation of the arrow, pointing in the direction of the vector quantity.
- The simulation tool allows users to visually represent and manipulate vectors by dragging their midpoints to reposition them and their heads to resize them (change magnitude). It then graphically displays the resultant vector when two vectors are added.
- To use the simulation for word problems, one should represent the vector quantities described in the problem using the arrows in the simulation. By adjusting the magnitudes and directions according to the problem, the simulation can then calculate and draw the resultant vector.
- Two learning goals mentioned are to (f) add two vectors to determine a resultant by a graphical method and (b) solve problems for a static point mass under the action of 3 forces for 2-dimensional cases (a graphical method would suffice).
- In static equilibrium, the net force acting on an object is zero. Graphically, this means that if all the force vectors acting on the point mass are added head-to-tail, the head of the last vector will coincide with the tail of the first vector, forming a closed polygon, and thus a zero resultant force.
Essay Format Questions
- Discuss the advantages and limitations of using the graphical method for vector addition. In what types of physical scenarios is this method particularly useful, and when might analytical methods be more appropriate?
- Explain how the interactive simulation described in the source material can enhance student understanding of vector addition. Discuss the specific features of the simulation and how they contribute to the learning process.
- Consider a real-world scenario involving multiple forces acting on an object (e.g., a boat being pulled by several ropes). Describe how you would use the graphical method to determine the net force acting on the object and whether the object is in equilibrium.
- Compare and contrast the head-to-tail method and the parallelogram method of graphical vector addition. Under what circumstances would you choose one method over the other? Illustrate your explanation with examples.
- The source material highlights the connection between graphical vector addition and solving problems involving static equilibrium. Elaborate on this connection, explaining how the concept of a zero resultant force is visualized using graphical methods when an object is in equilibrium under the influence of multiple forces.
Glossary of Key Terms
- Scalar Quantity: A physical quantity that has only magnitude (size or amount) and no direction. Examples include mass, temperature, and time.
- Vector Quantity: A physical quantity that has both magnitude and direction. Examples include displacement, velocity, and force.
- Magnitude (of a vector): The size or numerical value of a vector, often represented by the length of the arrow in a graphical representation.
- Direction (of a vector): The orientation of a vector in space, indicated by the direction in which the arrow points in a graphical representation.
- Resultant Vector: The single vector that represents the sum of two or more vectors. It has the same effect as the individual vectors acting together.
- Head-to-Tail Method: A graphical method of vector addition where the tail of the second vector is placed at the head of the first vector. The resultant vector is drawn from the tail of the first to the head of the second.
- Parallelogram Method: A graphical method of vector addition where the tails of two vectors are placed at the same point, and a parallelogram is constructed with these vectors as adjacent sides. The resultant vector is the diagonal of the parallelogram originating from the common tail.
- Graphical Method: A way of adding vectors using diagrams and scaled representations of their magnitudes and directions.
- Static Equilibrium: A state in which an object is at rest and the net force acting on it is zero. In terms of vectors, this means the vector sum of all forces acting on the object is zero.
Learning Objectives: https://sites.google.com/moe.edu.sg/a-level-physics-tlg/foundations-of-physics/quantities-measurement
Learning Outcomes: H2 - 1(h)(i)(j)
Curriculum Emphasis: Ways of Thinking and Doing [WOTD https://vle.learning.moe.edu.sg/mrv/moe-library/lesson/view/c788167e-5865-4166-b147-89330b50b6b2/cover SLS lesson includes questions that can be repeated indefinitely with random values inserted.
For Teacher
| Title | Authors | Level | Type | Updated |
| Vector Sum using Scale Drawing Link1, LinkICTconnection Link2, | Chan Weng Cheong Ezzy Maris Stella High Sch | Upper Secondary | Lesson Example | 5-Aug-2015 |
Versions:
http://www.phy.ntnu.edu.tw/ntnujava/index.php?topic=216.0 summation of vectors by Fu-Kwun Hwang
Other Resources
- http://www.phy.ntnu.edu.tw/ntnujava/index.php?topic=1247.0 vector addition of 2 vectors by Fu-Kwun Hwang
- http://www.phy.ntnu.edu.tw/ntnujava/index.php?topic=2018.0 summation of three vectors by Fu-Kwun Hwang
- http://ophysics.com/k1.html by This email address is being protected from spambots. You need JavaScript enabled to view it..
- http://ophysics.com/k2.html by This email address is being protected from spambots. You need JavaScript enabled to view it.
- http://ophysics.com/k3.html by This email address is being protected from spambots. You need JavaScript enabled to view it.
- https://www.geogebra.org/m/FCknj7c3 Vector Addition by ukukuku
- https://ggbm.at/u2cgrc5q by tan Seng kwang
Frequently Asked Questions: Vector Addition by Graphical Method
- What are scalars and vectors, and how do they differ? Scalars are quantities that are fully described by a magnitude (a numerical value with units). Examples include temperature, mass, and time. Vectors, on the other hand, are quantities that possess both magnitude and direction. Examples include displacement, velocity, and force. The crucial difference is the directional component of vectors.
- What is vector addition, and why is the graphical method useful? Vector addition is the process of finding the resultant vector that represents the combined effect of two or more vectors. The graphical method provides a visual way to perform this addition by representing vectors as arrows. The length of the arrow corresponds to the magnitude, and the arrowhead indicates the direction. This method is particularly useful for understanding the concept of vector addition and visualizing the resultant vector.
- How is the graphical method for adding two vectors typically performed? The graphical method for adding two vectors (let's call them A and B) involves placing the tail of the second vector (B) at the head of the first vector (A), while maintaining its original magnitude and direction. The resultant vector (R) is then drawn from the tail of the first vector (A) to the head of the second vector (B). The magnitude of R is the length of this new arrow, and its direction is from the starting point to the ending point. This is often referred to as the "head-to-tail" method.
- What tools or simulations are available to help visualize and perform vector addition graphically? There are various interactive simulations and applets available online that allow users to manipulate vectors and observe their sum graphically. These tools often allow users to drag vectors, change their magnitude and direction, and see the resultant vector update in real-time. Examples include the "Student Learning Space Vector Addition by Graphical Method JavaScript HTML5 Applet Simulation Model" from Open Source Physics @ Singapore, which randomly generates vectors and allows for interactive manipulation.
- What are some practical applications of vector addition? Vector addition is a fundamental concept in physics and engineering with numerous applications. It is used to determine the net force acting on an object, the resultant displacement of an object undergoing multiple movements, the combined velocity of an object affected by multiple influences (like wind and its own propulsion), and in solving problems involving static equilibrium where multiple forces are acting on a point mass.
- Can the graphical method be used to add more than two vectors? Yes, the graphical method can be extended to add more than two vectors. To do this, you simply place the tail of the next vector at the head of the previous resultant vector. You continue this process for all the vectors you want to add. The final resultant vector is drawn from the tail of the first vector in the sequence to the head of the last vector added.
- What are some challenges or limitations of the graphical method of vector addition? While the graphical method is excellent for visualization and conceptual understanding, its accuracy is limited by the precision of the drawings and measurements. For more precise calculations, analytical methods involving vector components are generally preferred. Additionally, drawing and accurately measuring vectors can become cumbersome and time-consuming when dealing with many vectors or vectors in three dimensions.
- How can the provided simulation be used for learning about vector addition? The "Student Learning Space Vector Addition by Graphical Method JavaScript HTML5 Applet Simulation Model" allows students to actively engage with the concept of vector addition. By dragging and resizing vectors, and observing the resultant, users can develop an intuitive understanding of how vectors combine. The simulation also includes examples and challenges, such as representing word problems graphically and verifying the results, which can deepen learning and problem-solving skills.
- Details
- Parent Category: 01 Foundations of Physics
- Category: 01 Measurements
- Hits: 12979