
About
For Teachers
Credits
Author: video: szu chuang, model lookang
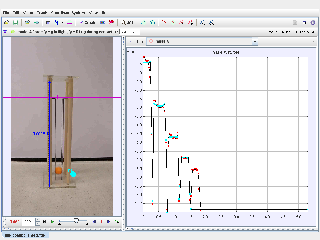
Document Brief: Energy Analysis of Ping Pong Ball Fall and Rebound Using Tracker
This document explores the motion and energy transformations of a ping pong ball as it falls and rebounds, captured and analyzed using Tracker software. The focus is on understanding how energy is transferred, conserved, or dissipated at different stages of the motion.
Purpose:
To analyze the energy transformations during free fall and rebound of a ping pong ball, demonstrating concepts of kinetic energy, gravitational potential energy, and energy loss due to inelastic collisions.
Key Features:
- Tracking the vertical motion of the ping pong ball.
- Analysis of total energy (te) vs. time (t) graph for each bounce.
- Identification of energy dissipation during each successive rebound.
- Graphical insights into inelastic collisions and energy loss.
Study Guide: Ping Pong Ball Energy Transformations
Learning Objectives:
- Understand the principles of energy conservation and dissipation in dynamic systems.
- Analyze the energy transformations during free fall and rebound phases.
- Quantify energy losses due to inelastic collisions at each bounce.
Step-by-Step Guide:
-
Setup and Calibration:
- Import the ping pong ball motion video into Tracker.
- Set the vertical coordinate system to measure the ball’s height accurately.
-
Motion Tracking:
- Track the position of the ball frame by frame during free fall and rebounds.
- Observe the plotted graph (te vs. t) for energy visualization.
-
Energy Graph Analysis:
- During free fall, observe the conversion of gravitational potential energy to kinetic energy.
- At impact, note the loss of energy due to the inelastic collision (te decreases).
- Measure the peak heights of successive bounces to calculate the percentage energy loss using: Energy Loss Percentage=(1−Bounce HeightPrevious Height)×100\text{Energy Loss Percentage} = \left(1 - \frac{\text{Bounce Height}}{\text{Previous Height}}\right) \times 100
-
Applications:
- Analyze the effect of different materials (e.g., ball surface or ground type) on energy dissipation.
- Explore real-world scenarios such as designing sports equipment or understanding material properties.
Tips for Success:
- Ensure accurate scaling and calibration for consistent results.
- Validate data by comparing theoretical predictions of energy conservation with measured results.
FAQ: Ping Pong Ball Energy Tracker
1. What is the purpose of this experiment?
To study energy transformations and quantify energy losses in the motion of a ping pong ball during free fall and successive rebounds.
2. Why does the total energy decrease with each bounce?
Energy decreases due to inelastic collisions where energy is lost as heat, sound, and deformation of the ball and surface.
3. Can the energy loss percentage be calculated?
Yes, using the heights of consecutive bounces and the formula:
Energy Loss Percentage=(1−Bounce HeightPrevious Height)×100\text{Energy Loss Percentage} = \left(1 - \frac{\text{Bounce Height}}{\text{Previous Height}}\right) \times 100
4. How can we minimize energy loss during rebounds?
By using more elastic materials for the ball and surface, minimizing energy dissipation during collisions.
5. What factors contribute to energy loss in this experiment?
- Inelastic deformation of the ball and surface.
- Heat and sound generated during collisions.
- Air resistance, though minimal in this context.
6. How does this relate to real-world applications?
This analysis is applicable in designing sports equipment, studying material properties, and understanding energy efficiency in dynamic systems.
- Details
- Written by Kimkia
- Parent Category: 04 Energy & Fields
- Category: 07 Energy Work Power
- Hits: 6561
