
.png
)


About
The pressure-volume conjugate pair is concerned with the transfer of mechanical or dynamic energy as the result of work.
* An isobaric process occurs at constant pressure. An example would be to have a movable piston in a cylinder, so that the pressure inside the cylinder is always at atmospheric pressure, although it is isolated from the atmosphere. In other words, the system is dynamically connected, by a movable boundary, to a constant-pressure reservoir.
* An isochoric process is one in which the volume is held constant, meaning that the work done by the system will be zero. It follows that, for the simple system of two dimensions, any heat energy transferred to the system externally will be absorbed as internal energy. An isochoric process is also known as an isometric process or an isovolumetric process. An example would be to place a closed tin can containing only air into a fire. To a first approximation, the can will not expand, and the only change will be that the gas gains internal energy, as evidenced by its increase in temperature and pressure. Mathematically, ?Q = dU. We may say that the system is dynamically insulated, by a rigid boundary, from the environment.
The temperature-entropy conjugate pair is concerned with the transfer of thermal energy as the result of heating.
* An isothermal process occurs at a constant temperature. An example would be to have a system immersed in a large constant-temperature bath. Any work energy performed by the system will be lost to the bath, but its temperature will remain constant. In other words, the system is thermally connected, by a thermally conductive boundary to a constant-temperature reservoir.
* An adiabatic process is a process in which there is no energy added or subtracted from the system by heating or cooling. For a reversible process, this is identical to an isentropic process. We may say that the system is thermally insulated from its environment and that its boundary is a thermal insulator. If a system has an entropy which has not yet reached its maximum equilibrium value, the entropy will increase even though the system is thermally insulated.
The following let you play with different processes:
The work done, heat transfer, internal energy as well as entropy change will be shown when you change parameter with slider bar.
Translations
| Code | Language | Translator | Run | |
|---|---|---|---|---|
 |
||||
Credits


Fu-Kwun Hwang; Fremont Teng; Loo Kang Wee
Overview:
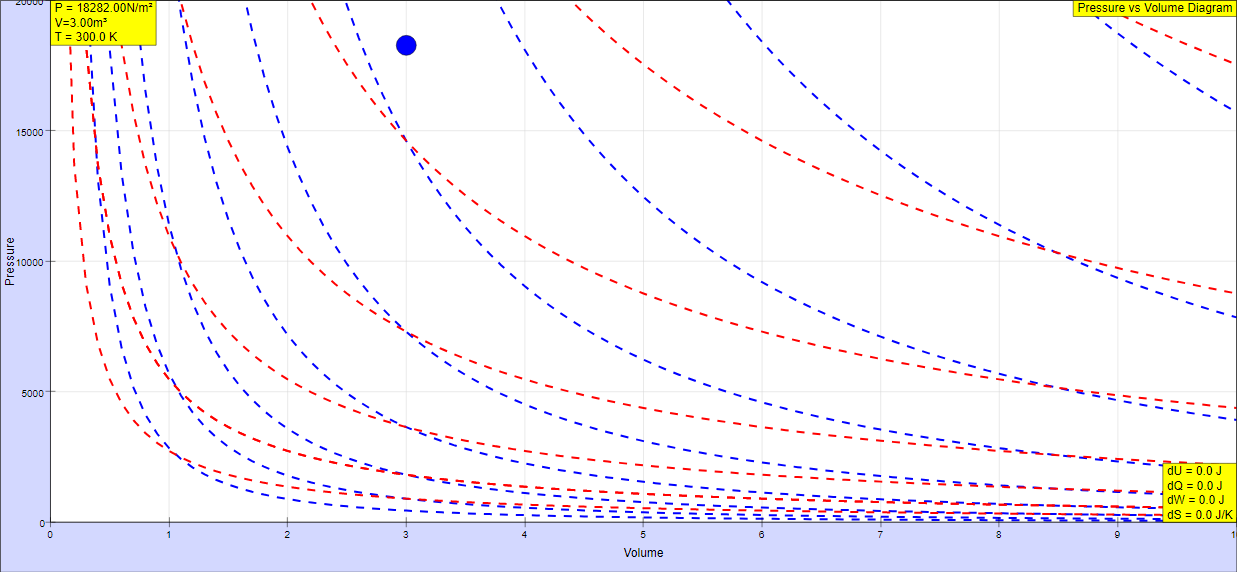
This document provides a briefing on the Pressure Volume Diagram JavaScript Simulation Applet HTML5 resource available on the Open Educational Resources / Open Source Physics @ Singapore website. This resource is an interactive simulation designed to help users understand thermodynamic processes and their representation on a pressure-volume (PV) diagram. The document outlines the main themes, key concepts explained, and the functionalities of the simulation.
Main Themes:
The primary theme of this resource is to visually and interactively demonstrate fundamental thermodynamic processes and their relationship to the transfer of energy, particularly work and heat, within a system. It emphasizes the concept of a "thermodynamic process [as] the energetic evolution of a thermodynamic system proceeding from an initial state to a final state." The resource focuses on how these processes are depicted as "paths through the space of thermodynamic variables," particularly pressure and volume.
Most Important Ideas and Facts:
The resource clearly defines and illustrates four key thermodynamic processes:
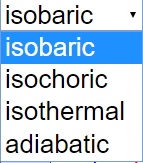
- Isobaric Process:
- Definition: A process occurring at constant pressure.
- Energy Transfer: Concerned with the transfer of mechanical or dynamic energy as work under constant pressure.
- Example: "An example would be to have a movable piston in a cylinder, so that the pressure inside the cylinder is always at atmospheric pressure..." This illustrates a system "dynamically connected, by a movable boundary, to a constant-pressure reservoir."
- Simulation Functionality: The simulation allows dragging the "ball" only horizontally in isobaric mode, reflecting the constant pressure (vertical axis on a PV diagram) and changing volume (horizontal axis).
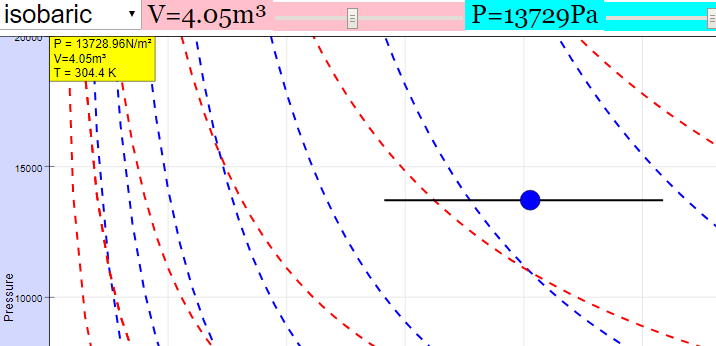
- Isochoric Process:
- Definition: A process where the volume is held constant.
- Energy Transfer: No work is done by the system. Any heat energy transferred to the system is absorbed as internal energy (\(\Delta Q = dU\)).
- Alternative Names: Also known as an isometric or isovolumetric process.
- Example: "An example would be to place a closed tin can containing only air into a fire. To a first approximation, the can will not expand, and the only change will be that the gas gains internal energy, as evidenced by its increase in temperature and pressure." The system is described as "dynamically insulated, by a rigid boundary, from the environment."
- Simulation Functionality: In isochoric mode, the "ball" can only be dragged horizontally, signifying a change in pressure (vertical axis) with no change in volume (horizontal axis).
- Isothermal Process:
- Definition: A process occurring at a constant temperature.
- Energy Transfer: Work done by the system is lost to a constant-temperature bath, while the system's temperature remains constant. The system is "thermally connected, by a thermally conductive boundary to a constant-temperature reservoir."
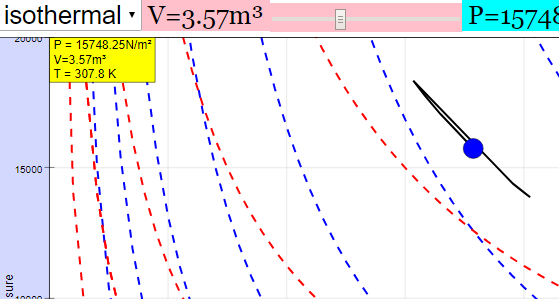
- Simulation Functionality: Isothermal mode allows diagonal dragging of the "ball," representing simultaneous changes in pressure and volume while maintaining a constant temperature (following a specific curve on the PV diagram).
- Adiabatic Process:
- Definition: A process with no heat exchange between the system and its surroundings. For a reversible process, it is identical to an isentropic process.
- Energy Transfer: The system is "thermally insulated from its environment and that its boundary is a thermal insulator." Entropy will increase if the system is not at its maximum equilibrium value.
- Simulation Functionality: Similar to isothermal, adiabatic mode permits diagonal dragging, but with a "different steepness" of the curve on the PV diagram, reflecting the different relationship between pressure and volume under adiabatic conditions.
Simulation Features and Usage:
The applet provides several interactive elements for users to explore these processes:
- Mode Combo Box: Allows users to select the specific thermodynamic process they want to simulate (Isobaric, Isochoric, Isothermal, Adiabatic). The instructions clarify how dragging the "ball" is constrained in each mode. For example, "(Isobaric allows you to drag the ball only horizontally)" and "(Isochoric only allows horizontal dragging)."
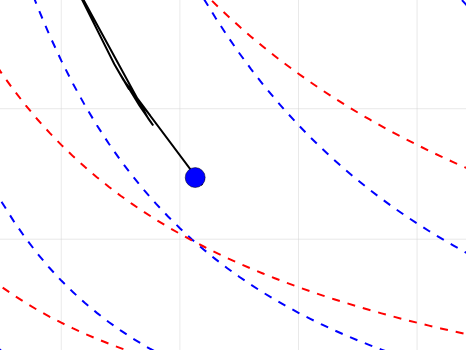
- Draggable Point: Users can interact with the simulation by dragging the "centre of the ball" on the PV diagram. As the point is dragged, "respective data about it" is displayed in the top left and bottom right corners, likely showing the corresponding pressure, volume, and potentially other thermodynamic variables.
- Pressure, Volume, and Temperature Sliders: These sliders enable users to "alter the variables" manually. However, the instructions note that "in some modes, the sliders will be unusable," indicating that certain variables are held constant depending on the selected thermodynamic process.
- Real-time Data Display: The simulation shows "the work done, heat transfer, internal energy as well as entropy change" as the user interacts with the simulation, providing immediate feedback on the energetic consequences of each process.
- Full Screen Toggle: Double-clicking allows for an expanded view of the simulation.
- Reset Button: Returns the simulation to its initial state.
Educational Value:
This JavaScript simulation applet offers significant educational value for understanding abstract thermodynamic concepts. The interactive nature allows students to:
- Visualize the paths of different thermodynamic processes on a PV diagram.
- Explore the relationships between pressure, volume, temperature, internal energy, work, heat transfer, and entropy in real-time.
- Experiment with different scenarios and observe the effects on the system's state and energy exchange.
- Reinforce their understanding of the definitions and characteristics of isobaric, isochoric, isothermal, and adiabatic processes through direct manipulation and observation.
Target Audience:
This resource is likely intended for students learning introductory thermodynamics in physics courses, potentially at the high school or undergraduate level. It can also be a valuable tool for teachers to demonstrate these concepts in a dynamic and engaging way.
Related Resources:
The resource page also includes a link to another GeoGebra applet visualizing the PV diagram for an Ideal Gas, suggesting further avenues for learning and exploration.
Credits:
The simulation was created by Fu-Kwun Hwang, Fremont Teng, and Loo Kang Wee, acknowledging the contributors to this open educational resource.
In Conclusion:
The Pressure Volume Diagram JavaScript Simulation Applet HTML5 is a valuable interactive tool for learning and teaching fundamental thermodynamic processes. By providing a visual and hands-on approach to understanding PV diagrams and the characteristics of isobaric, isochoric, isothermal, and adiabatic processes, it can significantly enhance comprehension of these key concepts in thermal physics. The inclusion of real-time data updates and interactive controls empowers users to actively explore the relationships between thermodynamic variables and energy transfer.
Pressure-Volume Diagrams and Thermodynamic Processes Study Guide
Key Concepts
- Thermodynamic System: A defined region of space containing matter and energy that is the focus of a thermodynamic analysis.
- Thermodynamic State: The condition of a thermodynamic system as described by its macroscopic properties such as pressure, volume, temperature, and internal energy.
- Thermodynamic Process: An energetic evolution of a thermodynamic system as it transitions from an initial state to a final state.
- Pressure-Volume (PV) Diagram: A graph that plots the pressure of a system against its volume, often used to visualize thermodynamic processes. The area under the curve represents the work done by or on the system during the process.
- Conjugate Pairs: Pairs of thermodynamic variables whose product has units of energy, such as pressure and volume (mechanical energy) and temperature and entropy (thermal energy).
Types of Thermodynamic Processes:
- Isobaric Process: A process that occurs at constant pressure. In a PV diagram, this is represented by a horizontal line. Work done is given by W = PΔV.
- Isochoric Process (Isometric or Isovolumetric): A process that occurs at constant volume. In a PV diagram, this is represented by a vertical line. Since there is no change in volume, the work done by the system is zero (W = 0). Any heat added to the system increases its internal energy (ΔQ = ΔU).
- Isothermal Process: A process that occurs at constant temperature. In a PV diagram, this is represented by a curve (for an ideal gas, it's a hyperbola). The system is in thermal contact with a constant-temperature reservoir, allowing heat exchange to maintain constant temperature during work done.
- Adiabatic Process: A process in which there is no heat exchange (ΔQ = 0) between the system and its surroundings. The system is thermally insulated. In a PV diagram, this is represented by a steeper curve than an isothermal process. Changes in internal energy are solely due to work done by or on the system (ΔU = -W).
- Reversible Process: A thermodynamic process that can be reversed by an infinitesimal change in the surroundings, and the system and surroundings return to their initial states. An adiabatic process is reversible if the entropy remains constant (isentropic).
- Work (W): Energy transferred to or from a system by a force acting through a displacement. In a PV diagram, it's the area under the curve.
- Heat (Q): Energy transferred between a system and its surroundings due to a temperature difference.
- Internal Energy (U): The total energy stored within a system, including kinetic and potential energy of its molecules. According to the first law of thermodynamics, ΔU = Q - W.
- Entropy (S): A measure of the disorder or randomness of a system. For a reversible adiabatic process, entropy remains constant (isentropic).
Quiz
- Describe an isobaric process. Provide a real-world example and illustrate how it would appear on a pressure-volume diagram.
- What is the defining characteristic of an isochoric process? Explain why no work is done by the system during such a process.
- Explain the conditions necessary for an isothermal process to occur. How does heat transfer play a role in maintaining a constant temperature?
- What distinguishes an adiabatic process from other thermodynamic processes? What can be said about heat exchange between the system and its surroundings in an adiabatic process?
- Define the concept of work in the context of thermodynamics and how it relates to a pressure-volume diagram. What does the area under the curve signify?
- State the first law of thermodynamics and explain the relationship between heat, work, and internal energy change in a thermodynamic system.
- In an isochoric process, if heat is added to the system, what is the effect on the internal energy and temperature of the system? Explain your reasoning.
- How does an isothermal expansion differ from an adiabatic expansion in terms of temperature change and heat transfer?
- Explain the relationship between a reversible adiabatic process and an isentropic process. What does "isentropic" mean?
- How can a pressure-volume diagram be used to understand the energetic evolution of a thermodynamic system during a process?
Quiz Answer Key
- An isobaric process is a thermodynamic process that occurs at a constant pressure. An example is heating water in an open container at atmospheric pressure, where the pressure remains constant as the water expands to steam. On a PV diagram, this process is represented by a horizontal line.
- The defining characteristic of an isochoric process is that the volume of the system remains constant. No work is done by the system during an isochoric process because work is defined as force acting through a distance (or pressure times change in volume), and with no change in volume (ΔV = 0), the work done (W = PΔV) is zero.
- An isothermal process occurs at a constant temperature, which requires the system to be in thermal contact with a large constant-temperature reservoir. Heat transfer allows the system to exchange energy with the reservoir, ensuring that any work done by the system is compensated by heat absorbed, or any work done on the system is dissipated as heat to maintain a constant temperature.
- An adiabatic process is distinguished by the absence of heat exchange between the system and its surroundings. This means the system is thermally insulated, and no energy is added or removed as heat during the process.
- In thermodynamics, work is the energy transferred when a force acts on a system and causes a displacement of its boundary. On a pressure-volume diagram, the area under the curve representing a thermodynamic process signifies the amount of work done by or on the system during that process.
- The first law of thermodynamics states that the change in the internal energy (ΔU) of a system is equal to the heat (Q) added to the system minus the work (W) done by the system: ΔU = Q - W. This law expresses the principle of energy conservation.
- In an isochoric process, the volume is constant (ΔV = 0), so no work is done (W = 0). According to the first law of thermodynamics (ΔU = Q - W), if heat (Q) is added to the system, the change in internal energy (ΔU) is equal to the heat added (ΔU = Q). Since internal energy is related to temperature, the temperature of the system will increase.
- During an isothermal expansion, the temperature remains constant, and the system absorbs heat from the surroundings to do work. In contrast, during an adiabatic expansion, no heat is exchanged, and the system does work at the expense of its internal energy, resulting in a decrease in temperature.
- A reversible adiabatic process is identical to an isentropic process. "Isentropic" means that the entropy of the system remains constant throughout the process. This occurs in a reversible adiabatic process because there is no heat transfer (ΔQ = 0), and the process is carried out in a way that does not increase entropy due to irreversibilities.
- A pressure-volume diagram visually represents the changes in pressure and volume of a thermodynamic system as it undergoes a process. The path taken on the diagram indicates the type of process, and the area under the curve quantifies the work done. By analyzing the initial and final states and the path connecting them, one can understand the energy transfer (as work) and infer changes in other thermodynamic properties like temperature and internal energy.
Essay Format Questions
- Discuss the four main types of thermodynamic processes (isobaric, isochoric, isothermal, and adiabatic), highlighting their defining characteristics, how they are represented on a pressure-volume diagram, and provide a real-world example of each.
- Explain the significance of the pressure-volume diagram as a tool for understanding work done by or on a thermodynamic system. How does the path taken during a process on a PV diagram affect the amount of work done, and what does the area under the curve represent?
- Describe the relationship between heat transfer, work done, and the change in internal energy of a thermodynamic system, as defined by the first law of thermodynamics. Illustrate this relationship with examples of isobaric and isochoric processes.
- Compare and contrast isothermal and adiabatic processes. Discuss the conditions under which each occurs, the role of heat transfer, and the resulting changes in temperature and internal energy of the system.
- Consider a system undergoing a cyclic process, returning to its initial state after a series of thermodynamic changes. Using the concept of the pressure-volume diagram and the first law of thermodynamics, discuss the net work done and the net heat transfer for such a cycle.
Glossary of Key Terms
- Adiabatic: A thermodynamic process in which there is no heat exchange between the system and its surroundings.
- Entropy: A thermodynamic quantity representing the unavailability of a system's thermal energy for conversion into mechanical work, often interpreted as a measure of the disorder or randomness of a system.
- Isobaric: A thermodynamic process that occurs at constant pressure.
- Isochoric (Isometric/Isovolumetric): A thermodynamic process that occurs at constant volume.
- Isentropic: A thermodynamic process that occurs at constant entropy, typically a reversible adiabatic process.
- Isothermal: A thermodynamic process that occurs at constant temperature.
- Pressure-Volume Diagram (PV Diagram): A graph showing the pressure of a thermodynamic system plotted against its volume, used to visualize processes and calculate work.
- Thermodynamic Process: The energetic evolution of a thermodynamic system proceeding from an initial state to a final state.
- Thermodynamic System: A defined region of space containing matter and energy that is the subject of thermodynamic analysis.
- Work: Energy transferred to or from a system by a force acting through a displacement of the system's boundary. In thermodynamics, particularly related to changes in volume against an external pressure.
Sample Learning Goals
[text]
For Teachers
Pressure Volume Diagram JavaScript Simulation Applet HTML5
Instructions
Combo Box for Mode

Draggable Point
Pressure, Volume and Temperature Sliders
Toggling Full Screen
Reset Button

Research
[text]
Video
[text]
Version:
Other Resources
- PV diagram for an Ideal Gas https://www.geogebra.org/m/xyqhfvyw by Tan Seng Kwang
Frequently Asked Questions: Pressure-Volume Diagrams and Thermodynamic Processes
1. What is a thermodynamic process?
A thermodynamic process describes the energetic evolution of a thermodynamic system as it transitions from an initial state to a final state. This evolution involves changes in the system's thermodynamic variables such as pressure, volume, and temperature. The "path" of the process is often defined by holding one or more of these variables constant.
2. What is the significance of a Pressure-Volume (PV) diagram in thermodynamics?
A Pressure-Volume (PV) diagram is a graphical tool used to visualize thermodynamic processes. The pressure (P) of the system is plotted on one axis (typically the vertical axis), and the volume (V) of the system is plotted on the other axis (typically the horizontal axis). The path traced on the PV diagram represents the series of states the system goes through during a thermodynamic process. The area under the curve in a PV diagram represents the work done by or on the system during the process.
3. What is an isobaric process? Can you provide an example?
An isobaric process is a thermodynamic process that occurs at constant pressure. On a PV diagram, this process is represented by a horizontal line. An example of an isobaric process is heating water in an open container at atmospheric pressure. As heat is added, the volume of the water (and eventually steam) increases while the pressure remains constant at atmospheric pressure because the system is open to the atmosphere and has a movable boundary.
4. What is an isochoric process? What are its key characteristics?
An isochoric process, also known as an isometric or isovolumetric process, is a thermodynamic process that occurs at constant volume. On a PV diagram, this process is represented by a vertical line. A key characteristic of an isochoric process is that no work is done by or on the system (since work is related to the change in volume). Therefore, any heat energy transferred to the system in an isochoric process will directly change its internal energy, resulting in a change in temperature and pressure. An example is heating a sealed, rigid container filled with gas. The volume cannot change, so the added heat increases the internal energy, temperature, and pressure of the gas.
5. What is an isothermal process? How does it relate to a constant temperature reservoir?
An isothermal process is a thermodynamic process that occurs at a constant temperature. On a PV diagram, this process is represented by a curve (for an ideal gas, it's a hyperbola). For a system to undergo an isothermal process, it must be in thermal contact with a large constant-temperature reservoir (a heat bath). This allows heat to be exchanged between the system and the reservoir to maintain a constant temperature. Any work done by the system is compensated by heat absorbed from the reservoir, and any work done on the system is expelled as heat to the reservoir.
6. What is an adiabatic process? How does it differ from an isothermal process?
An adiabatic process is a thermodynamic process in which no heat is exchanged between the system and its surroundings (the system is thermally insulated). On a PV diagram, an adiabatic process is represented by a curve that is generally steeper than an isothermal curve. Unlike an isothermal process where temperature remains constant due to heat exchange, in an adiabatic process, changes in internal energy are solely due to work done by or on the system, leading to changes in temperature.
7. How are work, heat transfer, internal energy, and entropy related in these thermodynamic processes?
The laws of thermodynamics govern the relationships between work, heat transfer, internal energy, and entropy in these processes.
- In an isobaric process, work is done due to the change in volume, and heat transfer contributes to changes in both internal energy and work. Entropy may increase or decrease depending on the direction of heat transfer.
- In an isochoric process, no work is done, so any heat transfer directly changes the internal energy. Entropy changes are related to the heat transfer and temperature.
- In an isothermal process, the change in internal energy is zero (for an ideal gas), so heat transfer is equal to the work done by or on the system. Entropy increases when heat is added and decreases when heat is removed.
- In an adiabatic process, there is no heat transfer, so the change in internal energy is equal to the negative of the work done by the system (or the work done on the system). Entropy remains constant for a reversible adiabatic process (isentropic) but can increase for an irreversible adiabatic process.
8. How can the provided JavaScript simulation applet be used to understand these thermodynamic processes?
The JavaScript simulation applet allows for interactive exploration of different thermodynamic processes (isobaric, isochoric, isothermal, and adiabatic) by manipulating parameters such as pressure, volume, and temperature. Users can drag a point on the PV diagram or use sliders to change these variables and observe the corresponding changes in work done, heat transfer, internal energy, and entropy. The applet visually demonstrates the paths of these processes on a PV diagram and provides real-time data, aiding in a deeper understanding of the relationships between thermodynamic variables and the characteristics of each process. The different dragging constraints in each mode (horizontal for isobaric/isochoric, diagonal with different steepness for isothermal/adiabatic) visually reinforce the definition of each process.
- Details
- Written by Fremont
- Parent Category: 13 Thermodynamic Systems
- Category: 04 Thermal Properties of Matter
- Hits: 9291