

.png
)


About
Phase space diagram
Phase space characterizes the interdependence of the variables and their derivatives in a given function y = y(x), for example y = y (x, y´,y´´). 2 dimensional phase space diagrams are projections of phase space onto a plane, as y = y (y´) or y´= y´(y´´). In 3D visualizations the projection can be spatial as in y = y( y´,y´´).
Phase space projections often characterize a function very evidently. In this simple simulation this is demonstrated for the periodicity of the sine function.
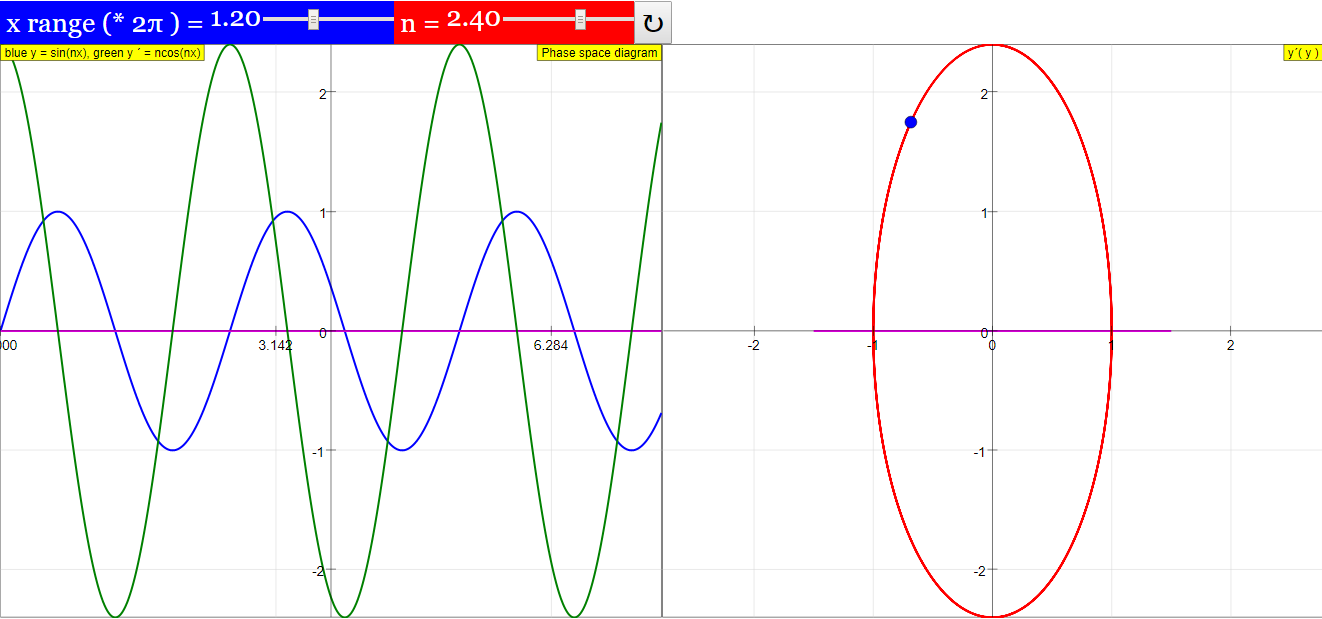
The left window shows the function y = sin (n x) itself in blue, its first derivative y´= ncos (nx) in green. The zero line is in magenta. With the slider n you can change the parameter n, which defines the number of periods in an x interval of 2π. Reset defines n = 1.
A second slider x range defines the range of x in the left window between 0.1 and 5 times 2π. Default value is 0.5, limiting the range of the function to one half period.
The right window shows the phase projection y´(y) in red. A blue point characterizes the relation y´(y) at the end of the x range. At default (n = 1 and xrange/2π=0.5) the phase space diagram is a half circle, corresponding to a half period of the function within the xrange. When xrange/2π is decreased, the phase space curve will contract. xrange/2π=1.0 leads to a full circle.
With n ≠ 1 the derivative has an amplitude n times that of the function. Correspondingly the phase diagram becomes an ellipse with an elongation of n. It has as many revolutions as the function has periods in the interval.
Periodicity is characterized by a closed space phase diagram with as many cycles as the function has periods.
Translations
| Code | Language | Translator | Run | |
|---|---|---|---|---|
 |
||||
Credits
 Dieter Roess - WEH- Foundation; Fremont Teng; Loo Kang Wee
Executive Summary:
This document reviews the "Phase Space Diagram JavaScript Simulation Applet HTML5," an interactive resource hosted by Open Educational Resources / Open Source Physics @ Singapore. The resource provides a JavaScript simulation designed to illustrate the concept of phase space diagrams, particularly in the context of periodic functions like the sine wave. The simulation allows users to visualize the relationship between a function and its first derivative, and how this relationship is represented in a 2D phase space projection. The key takeaway is that phase space diagrams offer a visual method to characterize the interdependence of variables and their rates of change, with periodicity clearly represented by closed loops in the phase space. The simulation is interactive, allowing users to manipulate parameters and observe the resulting changes in both the function and its phase space diagram.
Main Themes and Important Ideas/Facts:
- Definition and Purpose of Phase Space Diagrams:
- Phase space diagrams are introduced as tools that "characterize the interdependence of the variables and their derivatives in a given function y = y(x ), for example y = y (x, y´,y´´).".
- The resource focuses on 2-dimensional phase space diagrams, which are "projections of phase space onto a plane, as y = y (y ´) or y´= y´(y´´)." A specific example of y´(y) is used in the simulation.
- The document highlights the utility of these projections, stating that "Phase space projections often characterize a function very evidently."
- Demonstration using the Sine Function:
- The simulation uses the periodicity of the sine function (y = sin(nx)) as a primary example to illustrate phase space diagrams.
- The left window of the simulation displays the function itself (in blue) and its first derivative (y´ = ncos(nx) in green), along with a magenta zero line.
- The right window displays the phase projection y´(y) in red. A blue point tracks the relationship y´(y) at the end of the defined x range.
- Interactive Parameters and Their Effects:
- Slider 'n': This slider allows users to change the parameter 'n' in the sine function, which "defines the number of periods in an x interval of 2π." The "Reset" button sets 'n' back to 1.
- The briefing document notes that "With n ≠ 1 the derivative has an amplitude n times that of the function. Correspondingly the phase diagram becomes an ellipse with an elongation of n. It has as many revolutions as the function has periods in the interval."
- Slider 'x range': This slider adjusts the range of x displayed in the left window, from "0.1 and 5 times 2π." The default value is "0.5, limiting the range of the function to one half period."
- The document explains the impact on the phase space diagram: "At default ( n = 1 and xrange/2π=0.5 ) the phase space diagram is a half circle, corresponding to a half period of the function within the xrange. When xrange/2π is decreased, the phase space curve will contract. xrange/2π=1.0 leads to a full circle."
- Characterizing Periodicity in Phase Space:
- A key concept emphasized is the relationship between periodicity of a function and the shape of its phase space diagram: "Periodicity is characterized by a closed space phase diagram with as many cycles as the function has periods." This suggests that cyclic behavior in the function domain translates to closed loops in the phase space.
- Simulation Interface and Controls:
- The document provides basic instructions on how to interact with the simulation:
- "Adjusting the blue slider will change the x range, while the red slider will affect the position n of the object in the right diagram."
- "Double clicking anywhere in the panels will toggle full screen."
- "Reset Button Resets the simulation."
- An embed code (<iframe...>) is provided, allowing users to integrate the simulation into other webpages.
- Educational Context:
- The resource is categorized under "Mathematics" and "Learning and Teaching Mathematics using Simulations – Plus 2000 Examples from Physics," suggesting its intended use in educational settings.
- The inclusion of "Sample Learning Goals" and a section "For Teachers" (though the content of these is "[text]" in the provided excerpts) further indicates its pedagogical focus.
- Technical Details and Credits:
- The simulation is built using JavaScript and HTML5, making it accessible through modern web browsers without the need for additional plugins.
- Credits are given to Dieter Roess, Fremont Teng, and Loo Kang Wee for their contributions to the resource.
- The content is licensed under a Creative Commons Attribution-Share Alike 4.0 Singapore License, with a separate license for commercial use of the EasyJavaScriptSimulations Library.
- Broader Context of Open Educational Resources:
- The webpage is part of the "Open Educational Resources / Open Source Physics @ Singapore" initiative, highlighting a commitment to freely accessible educational materials.
- The extensive list of other interactive resources available on the platform demonstrates a wide range of physics and mathematics simulations.
Quotes:
- "Phase space characterizes the interdependence of the variables and their derivatives in a given function y = y(x ), for example y = y (x, y´,y´´). "
- "2 dimensional phase space diagrams are projections of phase space onto a plane, as y = y (y ´) or y´= y´(y´´). "
- "Phase space projections often characterize a function very evidently."
- "The left window shows the function y = sin (n x) itself in blue, its first derivative y´= ncos (nx) in green ."
- "The right window showsthe phase projection y´(y) in red."
- "With n ≠ 1 the derivative has an amplitude n times that of the function. Correspondingly the phase diagram becomes an ellipse with an elongation of n. It has as many revolutions as the function has periods in the interval."
- "Periodicity is characterized by a closed space phase diagram with as many cycles as the function has periods."
Conclusion:
The Phase Space Diagram JavaScript Simulation Applet HTML5 is a valuable and interactive tool for understanding the concept of phase space diagrams, particularly in relation to periodic functions. By visualizing the relationship between a function and its derivative in a phase space projection, users can gain a deeper intuitive understanding of the dynamics of these functions. The ability to manipulate parameters like frequency and the observed interval allows for exploration and reinforces the connection between the function's behavior and its representation in phase space. The resource is well-integrated into a broader collection of open educational materials, suggesting a strong commitment to interactive learning in mathematics and physics.
Phase Space Diagram Study Guide
Key Concepts:
- Phase Space: The space in which all possible states of a dynamical system are represented, with each possible state corresponding to one unique point in the phase space. For a function y = y(x), phase space involves the variables and their derivatives.
- Phase Space Diagram: A projection of the phase space onto a lower-dimensional plane, typically showing the relationship between a variable and its first derivative (e.g., y vs. y´). These diagrams visually represent the behavior of the function.
- Periodicity: A property of a function that repeats its values at regular intervals. In the context of phase space diagrams, periodicity is often characterized by closed loops or cycles.
- Derivatives: The rate of change of a function with respect to its independent variable. The first derivative (y´) indicates the slope of the function.
- Sine Function: A periodic function, y = sin(nx), that oscillates between -1 and 1. Its derivative is y´ = ncos(nx).
- Parameter n: In the function y = sin(nx), the parameter n controls the frequency or the number of periods within a given interval (e.g., 2π).
- x Range: The interval of the independent variable x over which the function and its phase space diagram are displayed.
- Ellipse in Phase Space: When the derivative has a different amplitude than the function (due to the parameter n), the phase space diagram for a sinusoidal function becomes an ellipse.
- Closed Loop/Cycle: In a phase space diagram, a closed loop indicates periodic behavior. The number of cycles corresponds to the number of periods of the function within the observed x range.
Short Answer Quiz:
- What is the purpose of a phase space diagram?
- How is a 2-dimensional phase space diagram created for a function y = y(x)? Provide an example of the axes.
- In the provided simulation, what function is primarily explored, and what are its displayed components in the left window?
- Explain the role of the slider labeled "n" in the simulation. How does changing this parameter affect the function and its phase space diagram?
- What does a closed loop in the phase space diagram typically indicate about the behavior of the corresponding function?
- Describe the shape of the phase space diagram for y = sin(x) (where n = 1) when the x range is set to one full period (i.e., xrange/2π = 1.0). Explain why.
- How does the phase space diagram change when the parameter n in y = sin(nx) is not equal to 1? What determines the elongation of the resulting shape?
- What happens to the phase space curve when the "x range" is decreased while keeping n = 1?
- According to the text, how many revolutions will the phase diagram have if the function has multiple periods within the displayed interval?
- How does the simulation demonstrate the periodicity of the sine function using the phase space diagram?
Answer Key:
- A phase space diagram serves to characterize the interdependence of a function's variables and their derivatives, providing a visual representation of the system's behavior. It can often reveal properties of the function more evidently.
- A 2-dimensional phase space diagram is a projection of the phase space onto a plane, typically plotting one of the function's variables against its first derivative, such as y on one axis and y´ on the other.
- The simulation primarily explores the sine function, y = sin(nx). The left window displays the function itself in blue, its first derivative y´ = ncos(nx) in green, and the zero line in magenta.
- The slider "n" controls the parameter n in the sine function, which determines the number of periods of the function within an x interval of 2π. Changing n alters the frequency of the function and the amplitude of its derivative, leading to an elliptical phase space diagram with an elongation of n and a corresponding number of revolutions.
- A closed loop or cycle in the phase space diagram typically indicates that the corresponding function exhibits periodic behavior, meaning it repeats its values over regular intervals of the independent variable.
- When n = 1 and the x range covers one full period, the phase space diagram for y = sin(x) is a full circle. This is because as the sine function completes one cycle, the relationship between its value and its derivative traces a circular path.
- When n ≠ 1, the phase diagram becomes an ellipse with an elongation of n. This is because the derivative y´ = ncos(nx) has an amplitude n times that of the function y = sin(nx), causing a stretched circular shape.
- When the "x range" is decreased while keeping n = 1, the phase space curve will contract. This is because a smaller x range corresponds to a smaller portion of the function's cycle being plotted, resulting in a smaller section of the circular phase space diagram.
- The phase diagram will have as many revolutions (closed cycles) as the function has periods within the displayed x interval. Each period of the function corresponds to one complete cycle in the phase space.
- The simulation demonstrates the periodicity of the sine function by showing that for each period of the sine wave in the left window, a closed loop is traced in the y´(y) phase space diagram in the right window. The number of closed loops directly corresponds to the number of periods displayed.
Essay Format Questions:
- Discuss the concept of phase space and explain how a phase space diagram provides insights into the behavior of a dynamical system, using the sine function simulation as a specific example.
- Explain how the parameters n and the x range affect the shape and characteristics of the phase space diagram for the function y = sin(nx). How do these changes relate to the properties of the sine function itself?
- The text states that "periodicity is characterized by a closed space phase diagram with as many cycles as the function has periods." Elaborate on this statement, explaining the connection between the periodic nature of a function and the closed loops observed in its phase space diagram.
- Compare and contrast the information presented in the left window (the function and its derivative) with the information presented in the right window (the phase space diagram). How do these two representations complement each other in understanding the behavior of the sine function?
- Considering the provided simulation and the concept of phase space diagrams, discuss the potential educational benefits of using such interactive tools for learning about functions, derivatives, and periodicity in mathematics.
Glossary of Key Terms:
- Amplitude: The maximum displacement or extent of a vibration or oscillation, measured from the position of equilibrium.
- Dynamical System: A system whose state evolves over time according to fixed rules.
- Frequency: The rate at which a periodic phenomenon occurs, measured in cycles per unit time or per unit distance. In y = sin(nx), it is related to n.
- Function: A relation between a set of inputs and a set of permissible outputs with the property that each input is related to exactly one output.
- Independent Variable: The variable for which values are chosen and which determines the value of other variables (e.g., x in y = y(x)).
- Oscillation: A repetitive variation, typically in time, of some measure about a central value or between two or more different states.
- Projection: The act of displaying a multi-dimensional object or space in a lower-dimensional space.
- Simulation: A model or enactment of a real-world process or system over time.
- Slider: A graphical control element that allows a user to continuously change a value by moving an indicator along a track.
- Variable: A quantity that may change its value.
Sample Learning Goals
[text]
For Teachers
Phase Space Diagram JavaScript Simulation Applet HTML5
Instructions
x-range and n Sliders
Toggling Full Screen
Reset Button

Research
[text]
Video
[text]
Version:
Other Resources
[text]
Phase Space Diagrams: An Overview
What is a phase space diagram?
A phase space diagram is a graphical tool that illustrates the relationship between the variables of a function and their derivatives. For a function y = y(x), a 2D phase space diagram often plots a variable against its first derivative (e.g., y versus y´), providing insights into the behavior of the function without explicitly showing its dependence on the independent variable x. Higher-dimensional phase spaces can also be projected onto lower-dimensional planes for visualization.
How does a phase space diagram relate to the original function?
The shape of the trajectory in the phase space diagram visually represents the characteristics of the original function. For instance, the provided simulation demonstrates this with the sine function. The left window shows the graph of y = sin(nx) and its derivative y´ = ncos(nx) as functions of x. The right window displays the phase space projection y´(y), where each point on the curve corresponds to a specific value of x. The movement along the phase space curve reflects the evolution of the function and its derivative as x changes.
What does a closed loop in a phase space diagram signify?
A closed loop in a 2D phase space diagram (plotting a variable against its first derivative) typically indicates periodic behavior in the original function. Each complete cycle around the closed loop corresponds to one period of the oscillation. The simulation shows that for y = sin(nx), a full circle in the y´(y) phase space diagram corresponds to one period of the sine function.
How does changing the parameter 'n' affect the phase space diagram of y = sin(nx)?
The parameter 'n' in y = sin(nx) controls the frequency (number of periods within a given interval). In the phase space diagram, changing 'n' alters the shape and the number of cycles. As 'n' increases, the amplitude of the derivative (y´ = ncos(nx)) increases proportionally, leading to an elongated elliptical shape of the phase space diagram. The number of revolutions in the ellipse corresponds to the number of periods of the sine function within the observed x range.
What is the effect of the 'x range' slider on the phase space diagram?
The 'x range' slider in the simulation determines the interval of the independent variable x that is displayed and considered for the phase space projection. Decreasing the 'x range' limits the portion of the function and its derivative that are plotted, resulting in a contracted phase space curve. For y = sin(nx) with n = 1, an 'x range' corresponding to half a period (0.5 * 2π) produces a semicircle in the phase space, while an 'x range' of one full period (1.0 * 2π) yields a complete circle.
How can phase space diagrams help in understanding function behavior?
Phase space diagrams offer a unique perspective on function behavior by illustrating the interdependence of a function's values and its rates of change. They can visually highlight important characteristics such as periodicity (closed loops), stability (attracting points or cycles), and the overall dynamics of the system represented by the function. The simulation exemplifies how the phase space projection of a sine function clearly reveals its periodic nature and how parameters like frequency affect this periodicity.
What are some potential applications of phase space diagrams?
While the simulation focuses on a simple mathematical function, phase space diagrams are a powerful tool in various scientific and engineering fields. They are used in physics to analyze the motion of dynamical systems (e.g., pendulums, oscillators), in biology to study population dynamics, in engineering to analyze the stability of control systems, and in mathematics to understand the behavior of differential equations. The ability to visualize the relationship between variables and their rates of change provides valuable insights into the underlying dynamics of these systems.
What is the purpose of the JavaScript simulation applet provided?
The JavaScript simulation applet serves as an interactive educational tool to help users understand the concept of phase space diagrams. By allowing users to manipulate parameters like 'n' (frequency) and the 'x range', the applet visually demonstrates how these changes affect both the graph of a function and its corresponding phase space projection. This hands-on approach can enhance learning by allowing users to explore the relationship between a function and its derivatives in a dynamic and visual manner, specifically using the sine function as an example.
- Details
- Written by Fremont
- Parent Category: 1 Functions and graphs
- Category: 1.1 Functions
- Hits: 7758