https://iwant2study.org/moodle402/mod/laejss/view.php?id=41
About
Topics
Progressive wavesTransverse and
Determination of frequency and wavelength
Stationary waves
Description
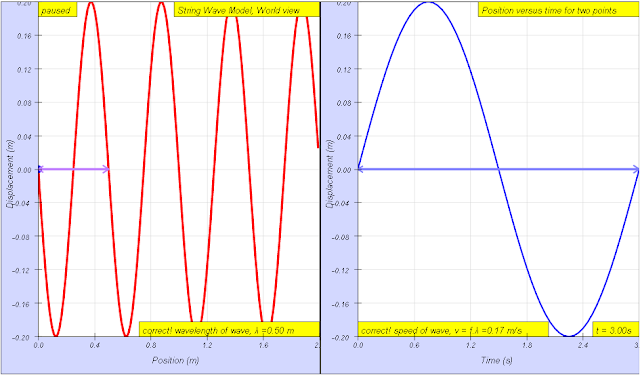
In this Wave representations simulation, you have two representations of wave motion to work with. The left one shows a movie of the wave traveling along a string - you can think of this representation as a sequence of photographs. The second right representation is a plot of the displacement as a function of time for two points on the string (you can select which two points to use). Using only these two representations, you can determine the values of many different parameters that describe the wave by changing the slider values or input fields. Hints have also been designed in for ease of visualizing the meaning of these parameters.
Play with the Wave Representations Model. Test what you've learned by exploring the amplitudes, wavelengths, periods, angular frequency, frequencies, wave velocities, maximum transverse velocity (linking to simple harmonic motion) and phase difference.
Sample Learning Goals
(a) show an understanding and use the terms displacement, amplitude, phase difference, period,frequency, wavelength and speed
(b) deduce, from the definitions of speed, frequency and wavelength, the equation v = fλ
(c) recall and use the equation v = fλ
(f) analyse and interpret graphical representations of transverse
(c) SHM: understand and use the terms amplitude, period, frequency, angular frequency and phase difference and express the period in terms of both frequency and angular frequency
Activities
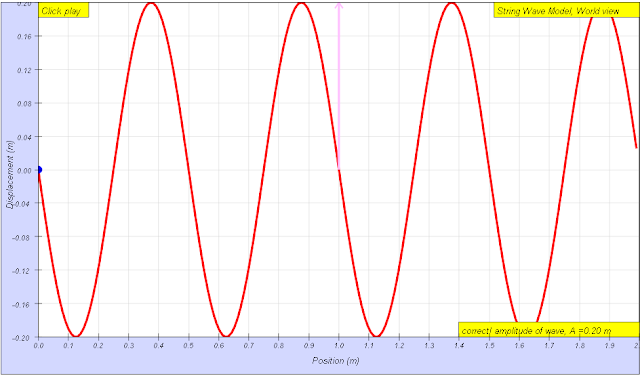
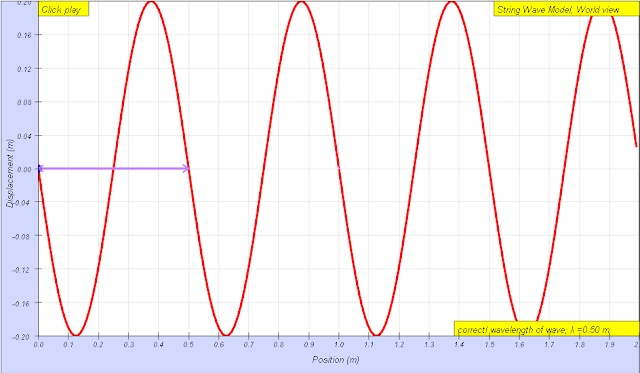
Reset the simulation to get a new random wave you are happy with.Amplitude, A and wavelength, λ can be determined using the left graph of displacement versus position.
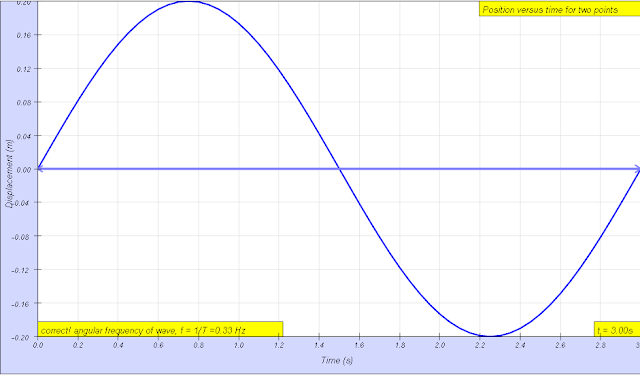
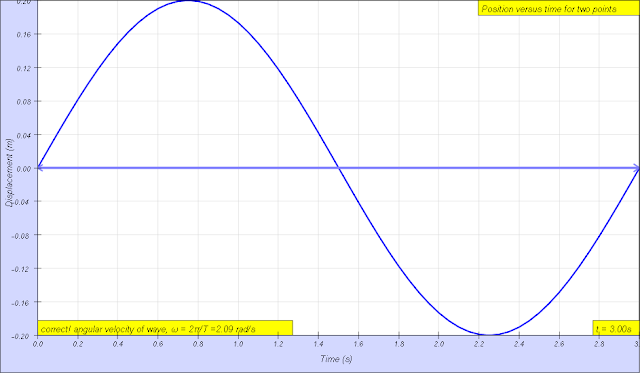
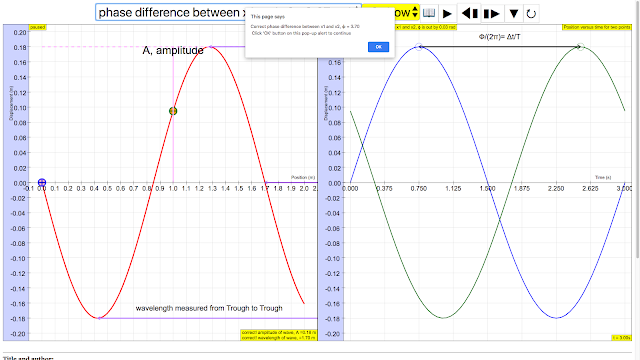
Then, play the simulation until you have a nice position versus time graph. Period, T and angular frequency, ω and frequency, f and phase difference between x1 and x2, φ using the relationship φ/(2π) = t/T, where t is the time difference between x1 and x2, can be determined using the right graph of displacement of x1 and x2 versus time.
Using both graphs, it is possible to determine wave velocity v = f λ, maximum transverse speed of a single point on the string, vmax= A ω. You can check your answers as many times as you want. The amplitude. The wavelength. The period. The angular frequency. The wave speed. The maximum transverse speed of a single point on the string.
Version:
- http://weelookang.blogspot.sg/2015/08/ejss-wave-representation-model.html
- http://weelookang.blogspot.sg/2011/04/ejs-open-source-wave-representations.html
- http://iwant2study.org/lookangejss/04waves_12generalwaves/ejs/ejs_model_Wave_representations_v5.jar
-
http://weelookang.blogspot.sg/2015/08/ejss-wave-representation-model.html
Wave representations
In this simulation, you have two representations of wave motion to work with. One shows a movie of the wave traveling along a string - you can think of this representation as a sequence of photographs. The second representation is a plot of the displacement as a function of time for two points on the string (you can select which two points to use). Using only these two representations, you can determine the values of many different parameters that describe the wave.
For more info : http://weelookang.blogspot.sg/2011/04/ejs-open-source-wave-representations.html
Activities
Keep pressing the "Get a new wave" button until you have a wave you are happy with. Then, play the simulation until you have a nice position versus time graph. Then, pause the simulation so that you have a photograph of the string as well as your position vs. time graph to work with. For each parameter below, figure out which of the two representations you need to determine the value of the parameter, and then find the value. You can check your answers as many times as you want.
- The amplitude.
- The wavelength.
- The period.
- The angular frequency.
- The wave speed.
- The maximum transverse speed of a single point on the string.
Translations
| Code | Language | Translator | Run | |
|---|---|---|---|---|
 |
||||
Credits


Andrew Duffy; lookang; tina
Briefing Document: 🌊Wave Representations Simulation Model
1. Overview
This document summarizes the key features and learning objectives associated with the "Wave Representations JavaScript HTML5 Applet Simulation Model," an interactive educational tool designed to visualize and explore the properties of waves. The simulation is part of the Open Educational Resources / Open Source Physics @ Singapore project.
2. Purpose and Functionality
The primary purpose of this simulation is to provide users with a hands-on, visual way to understand wave phenomena. It achieves this through two primary representations:
- Wave Movie: The left side of the simulation displays a "movie" of a wave traveling along a string, essentially a sequence of snapshots of the wave's shape at different points in time. This representation helps visualize wave propagation.
- Displacement vs. Time Graph: The right side shows a graph of the displacement of two selected points on the string as a function of time. This representation allows users to study the oscillatory motion of individual points within the wave.
- Interactive Exploration: Users can manipulate parameters via sliders and input fields to observe real time changes of the wave properties.
By using these two representations, users can determine various parameters that describe a wave and understand relationships between them, including amplitude, wavelength, period, frequency, angular frequency, wave speed, maximum transverse velocity and phase difference.
3. Target Audience and Subjects
The simulation is designed for secondary-level physics students and covers the following topics:
- Progressive waves
- Transverse and longitudinal waves
- Determination of frequency and wavelength
- Stationary waves
- Simple Harmonic Motion (SHM)
4. Key Concepts and Learning Goals
The simulation focuses on a variety of key concepts related to wave motion and simple harmonic motion, with specific learning goals. These goals include:
- Understanding and Using Wave Terminology (Goal a):Displacement: The distance of a point on the wave from its equilibrium position.
- Amplitude: "A is the maximum amplitude of the wave, maximum distance from the highest point of the disturbance in the medium (the crest) to the equilibrium point during one wave cycle."
- Phase difference: "the phase of a vibration (that is, its position within the vibration cycle) ϕ measured in radians"
- Period: "The period T is the time for one complete cycle of an oscillation of a wave."
- Frequency: "f is the number of periods per unit time (per second) and is related by T = 1/f".
- Wavelength: "wavelength is the distance between two sequential crests or troughs (or other equivalent points)"
- Speed: "sinusoidal waveform traveling at constant speed v is given by v = f λ"
- Relationship between Wave Speed, Frequency, and Wavelength (Goals b & c): Users are expected to deduce and use the equation v = fλ.
- Graphical Representation (Goal f): Understanding and analyzing graphical representations of transverse and longitudinal waves.
- SHM Concepts (Goal c): "understand and use the terms amplitude, period, frequency, angular frequency and phase difference and express the period in terms of both frequency and angular frequency."
- Maximum transverse speed: "The maximum transverse velocity is vmax = A ω and it occurs when the particle on the wave travels passes through the equilibrium position"
5. Activities and Exercises
The simulation encourages active learning through specific activities. These activities include:
- Parameter Determination: By manipulating the simulation and its two representations, users can determine the amplitude, wavelength, period, angular frequency, wave speed, and maximum transverse speed of a wave.
- Verification: Users can repeatedly check their answers.
- Phase Difference Calculation: Users can calculate phase difference between two points on a string using the graphs. "using the relationship φ/(2π) = t/T, where t is the time difference between x1 and x2, can be determined using the right graph of displacement of x1 and x2 versus time."
6. Mathematical Relationships and Equations
The simulation is based on the following mathematical representations:
- Wave Equation: The simulation uses the wave equation y = A sin (ωt + kx + ϕ), where:
- A is the amplitude.
- ω is the angular frequency.
- t is time.
- k is the wave number.
- x is the position.
- ϕ is the phase constant.
- Relationships:T = 1/f (period is the inverse of frequency)
- v = fλ (wave speed is the product of frequency and wavelength)
- "The angular frequencyω represents the frequency in radians per second"
- vmax= A ω (maximum transverse speed)
7. Accessibility
The simulation is accessible on various platforms:
- Windows/MacOSX/Linux including Laptops/Desktops
- Android/iOS including handphones/Tablets/iPads
- ChromeBook Laptops
8. Development and Credits
The simulation was developed by Andrew Duffy, lookang, and tina, with EJS authoring by Francisco Esquembre.
9. Additional Resources and Versions
The document includes links to various resources, including:
- Blog posts detailing the simulation development process.
- Direct links to run and download various versions of the simulation.
- Links to similar simulations from other creators.
10. Example Parameters and Values
The document includes examples of wave parameters from related resources:
- Amplitude: Examples given as 0.18 m and 0.20 m.
- Wavelength: Examples given as 1.70 m and 0.50 m.
- Period: Example given as 3.00 s.
- Angular Frequency: Example given as 2.09 s.
11. Key Takeaways
- The "Wave Representations" simulation is a versatile educational tool that promotes interactive learning and exploration of wave properties.
- It provides a visual and hands-on way to connect abstract concepts to concrete representations of waves, including longitudinal and transverse waves.
- The focus on both wave motion and simple harmonic motion, enhances the understanding of wave phenomena and its relationship to SHM.
- The simulation is accessible across various platforms, making it widely usable.
Wave Representations Study Guide
Quiz
Instructions: Answer the following questions in 2-3 sentences each, based on the provided source material.
- What are the two representations of wave motion used in the simulation and what does each display?
- How can you determine the amplitude of a wave using the simulation's representations?
- Explain how to determine the wavelength of a wave using the simulation.
- Using the right graph, how can you find the period (T) of a wave?
- Define frequency (f) and give its relationship to period (T).
- What is angular frequency (ω) and how does it relate to regular frequency?
- What is the formula for calculating wave speed (v) and what parameters does it use?
- How can the phase difference between two points on the string be determined?
- Where does maximum transverse velocity of a wave particle occur and how is it calculated?
- What is the significance of the equation ( y = A sin ( \omega t - k x ) ) in the simulation?
Quiz Answer Key
- The simulation provides two views: one shows a movie of a wave traveling along a string, representing a sequence of photographs, and the other is a graph showing the displacement of two points on the string as a function of time.
- The amplitude of a wave can be determined by examining the left representation of the wave (displacement versus position). The amplitude is the maximum displacement from the equilibrium position on the string in this view.
- The wavelength can be determined using the left graph of displacement versus position. It is the distance between two sequential crests or troughs (or other equivalent points).
- The period (T) of a wave can be found on the right-hand graph, which displays the displacement of two points as a function of time. The period is the time it takes for one complete cycle of an oscillation.
- Frequency (f) is the number of periods per unit time, measured in Hertz, and it is the inverse of the period (T), related by the formula f = 1/T.
- Angular frequency (ω) represents the frequency in radians per second, and it is related to regular frequency (f) by the equation ω = 2πf.
- The formula for wave speed (v) is v = fλ, where f is the frequency, and λ is the wavelength of the wave.
- The phase difference can be determined by calculating φ/(2π) = t/T, where t is the time difference between x1 and x2, and T is the period of the wave.
- The maximum transverse velocity occurs when the particle on the wave passes through the equilibrium position. It is calculated as vmax = Aω where A is the amplitude and ω is the angular frequency.
- The equation ( y = A sin ( \omega t - k x ) ) is used to model a transverse wave, where A is the amplitude, ω is the angular frequency, t is time, k is the wave number, and x is the position.
Essay Questions
Instructions: Answer the following essay questions thoroughly based on your understanding of the source material.
- Discuss the relationship between the two graphical representations provided in the simulation and how they complement each other in determining various wave parameters.
- Explain the concept of wave propagation and how the simulation models it, including the roles of transverse displacement and energy transfer.
- Analyze how changing different parameters (amplitude, wavelength, frequency) in the simulation affects the behavior of the wave, linking them to the underlying physics principles.
- Compare and contrast transverse and longitudinal waves. Explain why the simulation is modeled as a transverse wave and what this choice implies for the direction of oscillation versus energy propagation.
- How does the concept of simple harmonic motion (SHM) relate to the wave simulation, and where can you see elements of SHM in the graphs?
Glossary of Key Terms
Amplitude (A): The maximum displacement of a particle from its equilibrium position during a wave cycle. It represents the intensity of the wave.
Wavelength (λ): The distance between two consecutive crests (or troughs) in a wave. It is a spatial characteristic of the wave.
Period (T): The time taken for one complete cycle of oscillation in a wave. It is the time interval between two consecutive crests (or troughs) passing a fixed point.
Frequency (f): The number of complete cycles of oscillation per unit time, typically measured in Hertz (Hz). It's the inverse of the period (f = 1/T).
Angular Frequency (ω): A measure of frequency in radians per second. It's related to the standard frequency by ω = 2πf.
Phase Difference (φ): The difference in the phase of oscillation between two points on a wave or between two waves. It determines the relative positions within a cycle.
Wave Speed (v): The speed at which a wave propagates through a medium. It is calculated by the equation v = fλ.
Transverse Wave: A type of wave where the displacement of the medium is perpendicular to the direction of energy propagation. A wave on a string is a classic example.
Longitudinal Wave: A type of wave where the displacement of the medium is parallel to the direction of energy propagation, like sound waves.
Simple Harmonic Motion (SHM): A type of oscillatory motion where the restoring force is proportional to the displacement, resulting in periodic motion.
Apps
Description
Introduction
Wave is an oscillation accompanied by a transfer of energy that travels through medium (space or mass)
Waves consist, instead, of oscillations or vibrations (of a physical quantity), around almost fixed locations
This simulation is on transverse wave where disturbance creates oscillations that are perpendicular to the propagation of energy transfer.
The equation for wave is A sin ( wt +kx + ϕ)
where
A is the maximum amplitude of the wave, maximum distance from the highest point of the disturbance in the medium (the crest) to the equilibrium point during one wave cycle.
w is is the angular frequency
t is time
k is is the wavenumber
x is the position
ϕ is the is the phase constant
concepts illustrated in the simulations include
T is the time for one complete cycle of an oscillation of a wave
f is the number of periods per unit time (per second) and is related by T = 1/f
λ is the wavelength
v is the velocity of the wave travelling and is related by v= f λ
vtmax is the maximum transverse velocity of the wave particle that occurs at the displacement d =0.
Examples
EJSS wave representation model
Equation used to model the wave is \( y = A sin ( \omega t - k x ) \)
Amplitude A
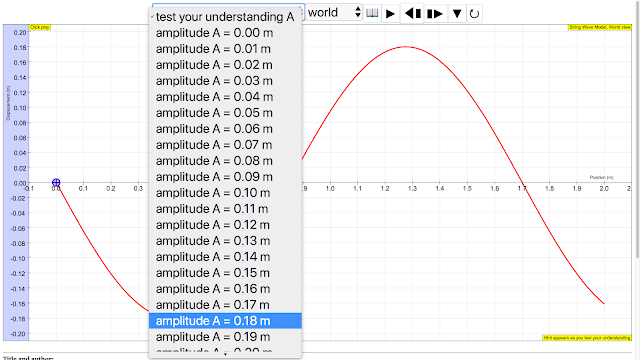 |
| amplitude of wave = 0.18 m, maximum displacement from equilibrium position https://sg.iwant2study.org/ospsg/index.php/112 Direct Link |
|
amplitude of wave = 0.20 m, maximum displacement from equilibrium position author: Andrew Duffy, lookang, tina author EJS: Francisco Esquembre |
wavelength λ
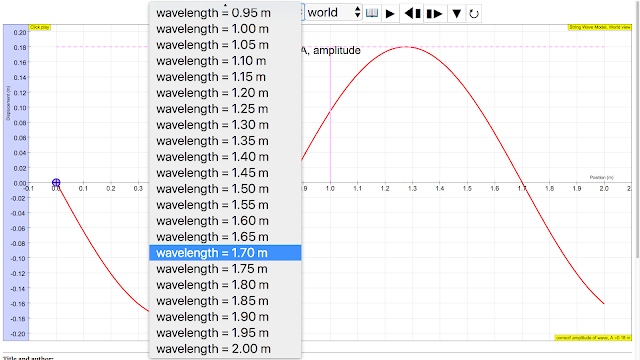 |
|
wavelength of wave = 1.70 m The wavelength λ wavelength is the distance between two sequential crests or troughs (or other equivalent points) |
|
wavelength of wave = 0.50 m The wavelength λ wavelength is the distance between two sequential crests or troughs (or other equivalent points) author: Andrew Duffy, lookang, tina author EJS: Francisco Esquembre |
Period T
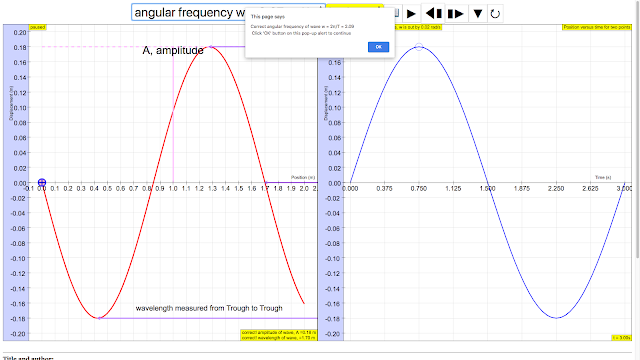 |
| period of wave = 3.00 s, The period T is the time for one complete cycle of an oscillation of a wave https://sg.iwant2study.org/ospsg/index.php/112 Direct Link |
|
period of wave = 3.00 s, The period T is the time for one complete cycle of an oscillation of a wave author: Andrew Duffy, lookang, tina author EJS: Francisco Esquembre |
angular frequency f
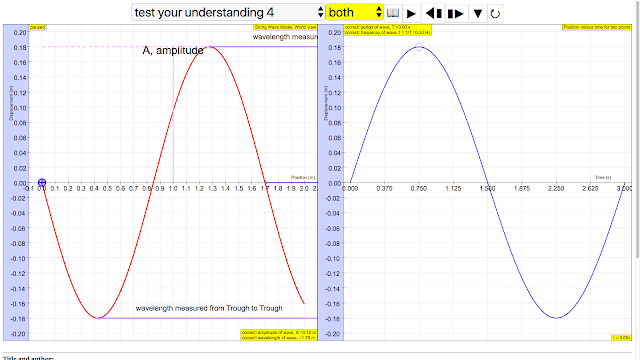 |
| The frequency f = 1/T is the number of periods per unit time (per second) and is typically measured in hertz https://sg.iwant2study.org/ospsg/index.php/112 Direct Link |
|
The frequency f = 1/T is the number of periods per unit time (per second) and is typically measured in hertz author: Andrew Duffy, lookang, tina author EJS: Francisco Esquembre |
angular velocity of wave ω
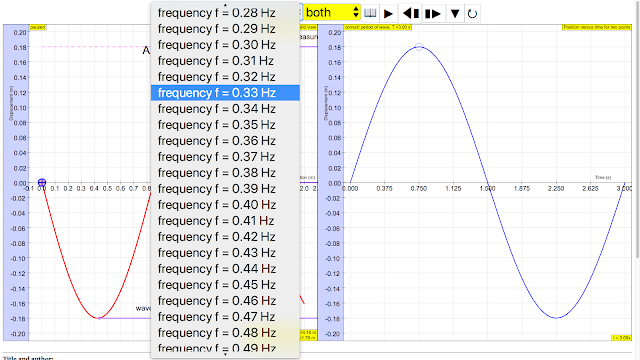 |
| angular frequencyω = 2.09 s, The angular frequencyω represents the frequency in radians per second. https://sg.iwant2study.org/ospsg/index.php/112 Direct Link |
|
angular frequencyω = 2.09 s, The angular frequencyω represents the frequency in radians per second. author: Andrew Duffy, lookang, tina author EJS: Francisco Esquembre |
phase difference ϕ
 |
|
the phase of a vibration (that is, its position within the vibration cycle) ϕ measured in radians taking ratio "ϕ/(2π)= Δt/T", ϕ = 2π(2.5-0.75)/3 =3.7 rad approximately |
wave speed v
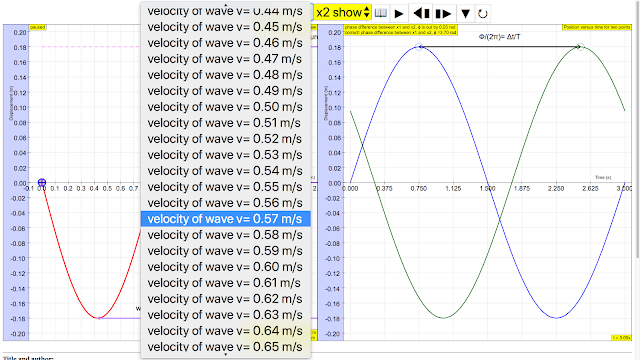 |
| sinusoidal waveform traveling at constant speed v is given by v = f λ https://sg.iwant2study.org/ospsg/index.php/112 Direct Link |
|
sinusoidal waveform traveling at constant speed v is given by v = f λ author: Andrew Duffy, lookang, tina author EJS: Francisco Esquembre |
maximum transverse speed vmax
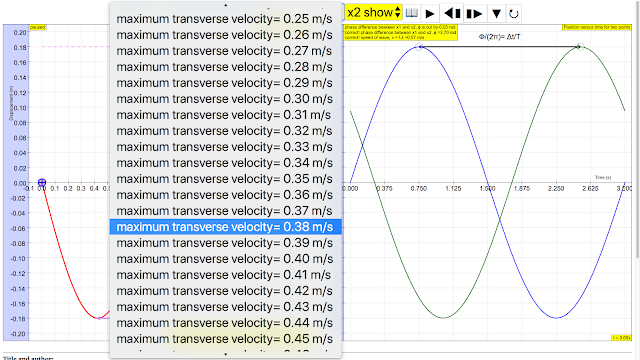 |
| The maximum transverse velocity is vmax = Aω and it occurs when the particle on the wave travels passes through the equilibrium position https://sg.iwant2study.org/ospsg/index.php/112 Direct Link |
|
The maximum transverse velocity is vmax = Aω and it occurs when the particle on the wave travels passes through the equilibrium position author: Andrew Duffy, lookang, tina author EJS: Francisco Esquembre |
reference:
http://weelookang.blogspot.sg/2011/04/ejs-open-source-wave-representations.html
Video
Versions
- http://weelookang.blogspot.sg/2015/08/ejss-wave-representation-model.html Blog post of JavaScript version of Wave Representations by Andrew Duffy and Loo Kang Wee
- http://weelookang.blogspot.sg/2011/04/ejs-open-source-wave-representations.html Blog post of Java version of Wave Representations by Andrew Duffy and Loo Kang Wee
- http://iwant2study.org/lookangejss/04waves_12generalwaves/ejs/ejs_model_Wave_representations_v5.jar Java version of Wave Representations by Andrew Duffy and Loo Kang Wee
Other Resources
- http://physics.bu.edu/~duffy/HTML5/wave_movie_and_graph.htmlby Andrew Duffy
- http://www.phy.ntnu.edu.tw/ntnujava/index.php?topic=2405.0 One dimensional moving wave y(x,t)=A sin(k*x-w*t) by Fu-Kwun Hwang
Wave Representation Simulation FAQ
1. What are the two main representations of wave motion provided in this simulation?
The simulation provides two key representations of wave motion. The first is a visual animation of a wave traveling along a string, which can be thought of as a series of snapshots. The second is a graph showing the displacement as a function of time for two selected points on the string, allowing for the analysis of how the wave affects specific locations over time.
2. What parameters of a wave can be determined using the simulation?
Using both representations provided, you can determine several wave parameters, including: amplitude (A), wavelength (λ), period (T), frequency (f), angular frequency (ω), wave speed (v), maximum transverse speed (vmax) of a single point on the string, and phase difference (φ) between two points on the string.
3. How can the amplitude and wavelength be found using the simulation's representations?
The amplitude (A), which is the maximum displacement from the equilibrium position, and the wavelength (λ), which is the distance between two successive crests or troughs, are determined from the first representation, the 'photograph' of the wave moving along the string. By observing the wave at a given time you can find these values.
4. How do you determine the period, frequency and angular frequency using the simulation?
The period (T), which is the time for one complete cycle of the oscillation, the frequency (f), which is the number of periods per unit time, and the angular frequency (ω), which is related to the frequency by the equation ω = 2πf, are determined from the second representation, the graph of displacement vs. time for selected points on the string. These values are measured by observing how much time a point takes to complete one cycle.
5. How can the wave speed be calculated from the parameters found in the simulation?
The wave speed (v) can be calculated using the equation v = fλ, where f is the frequency, and λ is the wavelength. You need to calculate these two parameters using both representations to then calculate v.
6. What is the maximum transverse speed, and how is it calculated within the simulation?
The maximum transverse speed (vmax) is the maximum speed at which a particle on the string oscillates perpendicular to the direction of the wave's travel. It occurs when the particle passes through the equilibrium position and can be calculated using the equation vmax = Aω, where A is the amplitude, and ω is the angular frequency.
7. What is phase difference and how is it determined using the simulation?
The phase difference (φ) describes the difference in the position of two points on the wave at the same point in time or the same point over time. It represents how "out of sync" two oscillations might be. In the simulation, this is calculated by taking the time difference between two points at a same phase. Using the relationship φ/(2π) = t/T, where t is the time difference between two points, you can calculate the phase difference between the two selected points using the position vs time graph.
8. What are some practical learning activities you can do with the simulation?
The simulation encourages hands-on exploration of wave characteristics. You can start by resetting the simulation to get a new random wave. Then, you use the two representations to determine various parameters, checking your answers as often as you wish. Additionally, you can manipulate slider values to observe how changes in wave parameters affect the wave's behavior on the representations. The simulation also helps visualise the relationship between Simple Harmonic Motion and a wave's transverse motion.
end faq
{accordionfaq faqid=accordion4 faqclass="lightnessfaq defaulticon headerbackground headerborder contentbackground contentborder round5"}
- Details
- Parent Category: 03 Waves
- Category: 01 General Waves
- Hits: 16318


.png
)


