
About
For Teachers
- decleleration till stop_bicycle_modelled with constant speed118.jpg
- decleleration till stop_bicycle_modelled with constant speed117.jpg
- decleleration till stop_bicycle_modelled with constant speed116.jpg
- decleleration till stop_bicycle_modelled with constant speed115.jpg
- decleleration till stop_bicycle_modelled with constant speed114.jpg
- decleleration till stop_bicycle_modelled with constant speed113.jpg
- decleleration till stop_bicycle_modelled with constant speed112.jpg
- decleleration till stop_bicycle_modelled with constant speed111.jpg
- decleleration till stop_bicycle_modelled with constant speed110.jpg
- decleleration till stop_bicycle_modelled with constant speed109.jpg
- decleleration till stop_bicycle_modelled with constant speed108.jpg
- decleleration till stop_bicycle_modelled with constant speed107.jpg
- decleleration till stop_bicycle_modelled with constant speed106.jpg
- decleleration till stop_bicycle_modelled with constant speed105.jpg
- decleleration till stop_bicycle_modelled with constant speed104.jpg
- decleleration till stop_bicycle_modelled with constant speed103.jpg
- decleleration till stop_bicycle_modelled with constant speed102.jpg
- decleleration till stop_bicycle_modelled with constant speed101.jpg
- decleleration till stop_bicycle_modelled with constant speed100.jpg
- decleleration till stop_bicycle_modelled with constant speed099.jpg
- decleleration till stop_bicycle_modelled with constant speed098.jpg
- decleleration till stop_bicycle_modelled with constant speed097.jpg
- decleleration till stop_bicycle_modelled with constant speed096.jpg
- decleleration till stop_bicycle_modelled with constant speed095.jpg
- decleleration till stop_bicycle_modelled with constant speed094.jpg
- decleleration till stop_bicycle_modelled with constant speed093.jpg
- decleleration till stop_bicycle_modelled with constant speed092.jpg
- decleleration till stop_bicycle_modelled with constant speed091.jpg
- decleleration till stop_bicycle_modelled with constant speed090.jpg
- decleleration till stop_bicycle_modelled with constant speed089.jpg
- decleleration till stop_bicycle_modelled with constant speed088.jpg
- decleleration till stop_bicycle_modelled with constant speed087.jpg
- decleleration till stop_bicycle_modelled with constant speed086.jpg
- decleleration till stop_bicycle_modelled with constant speed085.jpg
- decleleration till stop_bicycle_modelled with constant speed084.jpg
- decleleration till stop_bicycle_modelled with constant speed083.jpg
- decleleration till stop_bicycle_modelled with constant speed082.jpg
- decleleration till stop_bicycle_modelled with constant speed081.jpg
- decleleration till stop_bicycle_modelled with constant speed080.jpg
- decleleration till stop_bicycle_modelled with constant speed079.jpg
- decleleration till stop_bicycle_modelled with constant speed078.jpg
- decleleration till stop_bicycle_modelled with constant speed077.jpg
- decleleration till stop_bicycle_modelled with constant speed076.jpg
- decleleration till stop_bicycle_modelled with constant speed075.jpg
- decleleration till stop_bicycle_modelled with constant speed074.jpg
- decleleration till stop_bicycle_modelled with constant speed073.jpg
- decleleration till stop_bicycle_modelled with constant speed072.jpg
- decleleration till stop_bicycle_modelled with constant speed071.jpg
- decleleration till stop_bicycle_modelled with constant speed070.jpg
- decleleration till stop_bicycle_modelled with constant speed069.jpg
- decleleration till stop_bicycle_modelled with constant speed068.jpg
- decleleration till stop_bicycle_modelled with constant speed067.jpg
- decleleration till stop_bicycle_modelled with constant speed066.jpg
- decleleration till stop_bicycle_modelled with constant speed065.jpg
- decleleration till stop_bicycle_modelled with constant speed064.jpg
- decleleration till stop_bicycle_modelled with constant speed063.jpg
- decleleration till stop_bicycle_modelled with constant speed062.jpg
- decleleration till stop_bicycle_modelled with constant speed061.jpg
- decleleration till stop_bicycle_modelled with constant speed060.jpg
- decleleration till stop_bicycle_modelled with constant speed059.jpg
- decleleration till stop_bicycle_modelled with constant speed058.jpg
- decleleration till stop_bicycle_modelled with constant speed057.jpg
- decleleration till stop_bicycle_modelled with constant speed056.jpg
- decleleration till stop_bicycle_modelled with constant speed055.jpg
- decleleration till stop_bicycle_modelled with constant speed054.jpg
- decleleration till stop_bicycle_modelled with constant speed053.jpg
- decleleration till stop_bicycle_modelled with constant speed052.jpg
- decleleration till stop_bicycle_modelled with constant speed051.jpg
- decleleration till stop_bicycle_modelled with constant speed050.jpg
- decleleration till stop_bicycle_modelled with constant speed049.jpg
- decleleration till stop_bicycle_modelled with constant speed048.jpg
- decleleration till stop_bicycle_modelled with constant speed047.jpg
- decleleration till stop_bicycle_modelled with constant speed046.jpg
- decleleration till stop_bicycle_modelled with constant speed045.jpg
- decleleration till stop_bicycle_modelled with constant speed044.jpg
- decleleration till stop_bicycle_modelled with constant speed043.jpg
- decleleration till stop_bicycle_modelled with constant speed042.jpg
- decleleration till stop_bicycle_modelled with constant speed041.jpg
- decleleration till stop_bicycle_modelled with constant speed040.jpg
- decleleration till stop_bicycle_modelled with constant speed039.jpg
- decleleration till stop_bicycle_modelled with constant speed038.jpg
- decleleration till stop_bicycle_modelled with constant speed037.jpg
- decleleration till stop_bicycle_modelled with constant speed036.jpg
- decleleration till stop_bicycle_modelled with constant speed035.jpg
- decleleration till stop_bicycle_modelled with constant speed034.jpg
- decleleration till stop_bicycle_modelled with constant speed033.jpg
- decleleration till stop_bicycle_modelled with constant speed032.jpg
- decleleration till stop_bicycle_modelled with constant speed031.jpg
- decleleration till stop_bicycle_modelled with constant speed030.jpg
- decleleration till stop_bicycle_modelled with constant speed029.jpg
- decleleration till stop_bicycle_modelled with constant speed028.jpg
- decleleration till stop_bicycle_modelled with constant speed027.jpg
- decleleration till stop_bicycle_modelled with constant speed026.jpg
- decleleration till stop_bicycle_modelled with constant speed025.jpg
- decleleration till stop_bicycle_modelled with constant speed024.jpg
- decleleration till stop_bicycle_modelled with constant speed023.jpg
- decleleration till stop_bicycle_modelled with constant speed022.jpg
- decleleration till stop_bicycle_modelled with constant speed021.jpg
- decleleration till stop_bicycle_modelled with constant speed020.jpg
- decleleration till stop_bicycle_modelled with constant speed019.jpg
- decleleration till stop_bicycle_modelled with constant speed018.jpg
- decleleration till stop_bicycle_modelled with constant speed017.jpg
- decleleration till stop_bicycle_modelled with constant speed016.jpg
- decleleration till stop_bicycle_modelled with constant speed015.jpg
- decleleration till stop_bicycle_modelled with constant speed014.jpg
- decleleration till stop_bicycle_modelled with constant speed013.jpg
- decleleration till stop_bicycle_modelled with constant speed012.jpg
- decleleration till stop_bicycle_modelled with constant speed011.jpg
- decleleration till stop_bicycle_modelled with constant speed010.jpg
- decleleration till stop_bicycle_modelled with constant speed009.jpg
- decleleration till stop_bicycle_modelled with constant speed008.jpg
- decleleration till stop_bicycle_modelled with constant speed007.jpg
- decleleration till stop_bicycle_modelled with constant speed006.jpg
- decleleration till stop_bicycle_modelled with constant speed005.jpg
- decleleration till stop_bicycle_modelled with constant speed004.jpg
- decleleration till stop_bicycle_modelled with constant speed003.jpg
- decleleration till stop_bicycle_modelled with constant speed002.jpg
- decleleration till stop_bicycle_modelled with constant speed001.jpg
- decleleration till stop_bicycle_modelled with constant speed000.jpg
- RateofchangeTanKimKiaRateofchange-lessonplan.doc
- RateofchangeGraphmotions-RateofChange.pptx
- Rateofchange1.constantspeed-deceleration-acceleration.mp4
- Rateofchange-guidedlessonnotes-studentscopy.doc
- Rateofchange-guidedlessonnotes-studentscopy-answer.doc
Credits
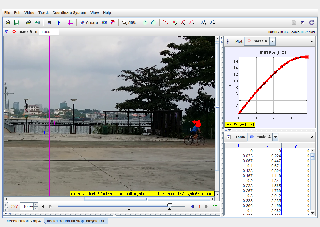
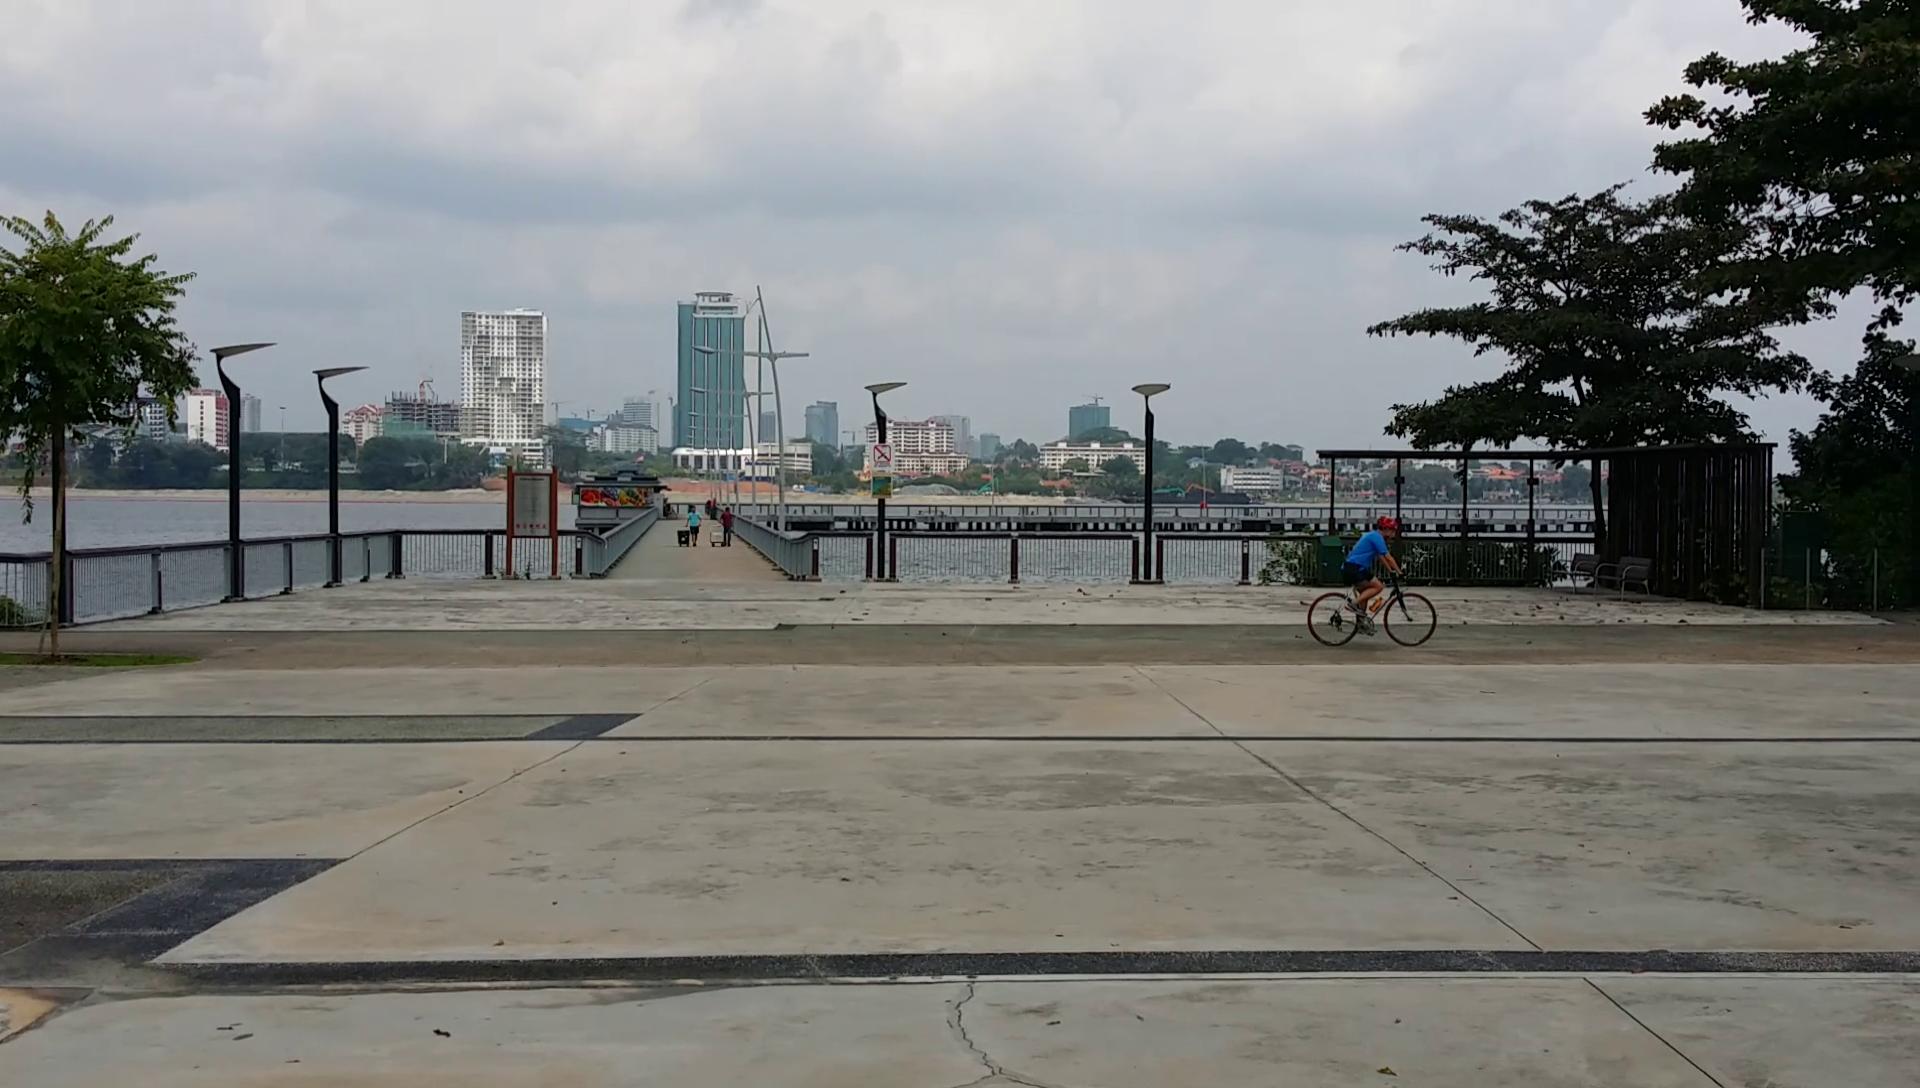
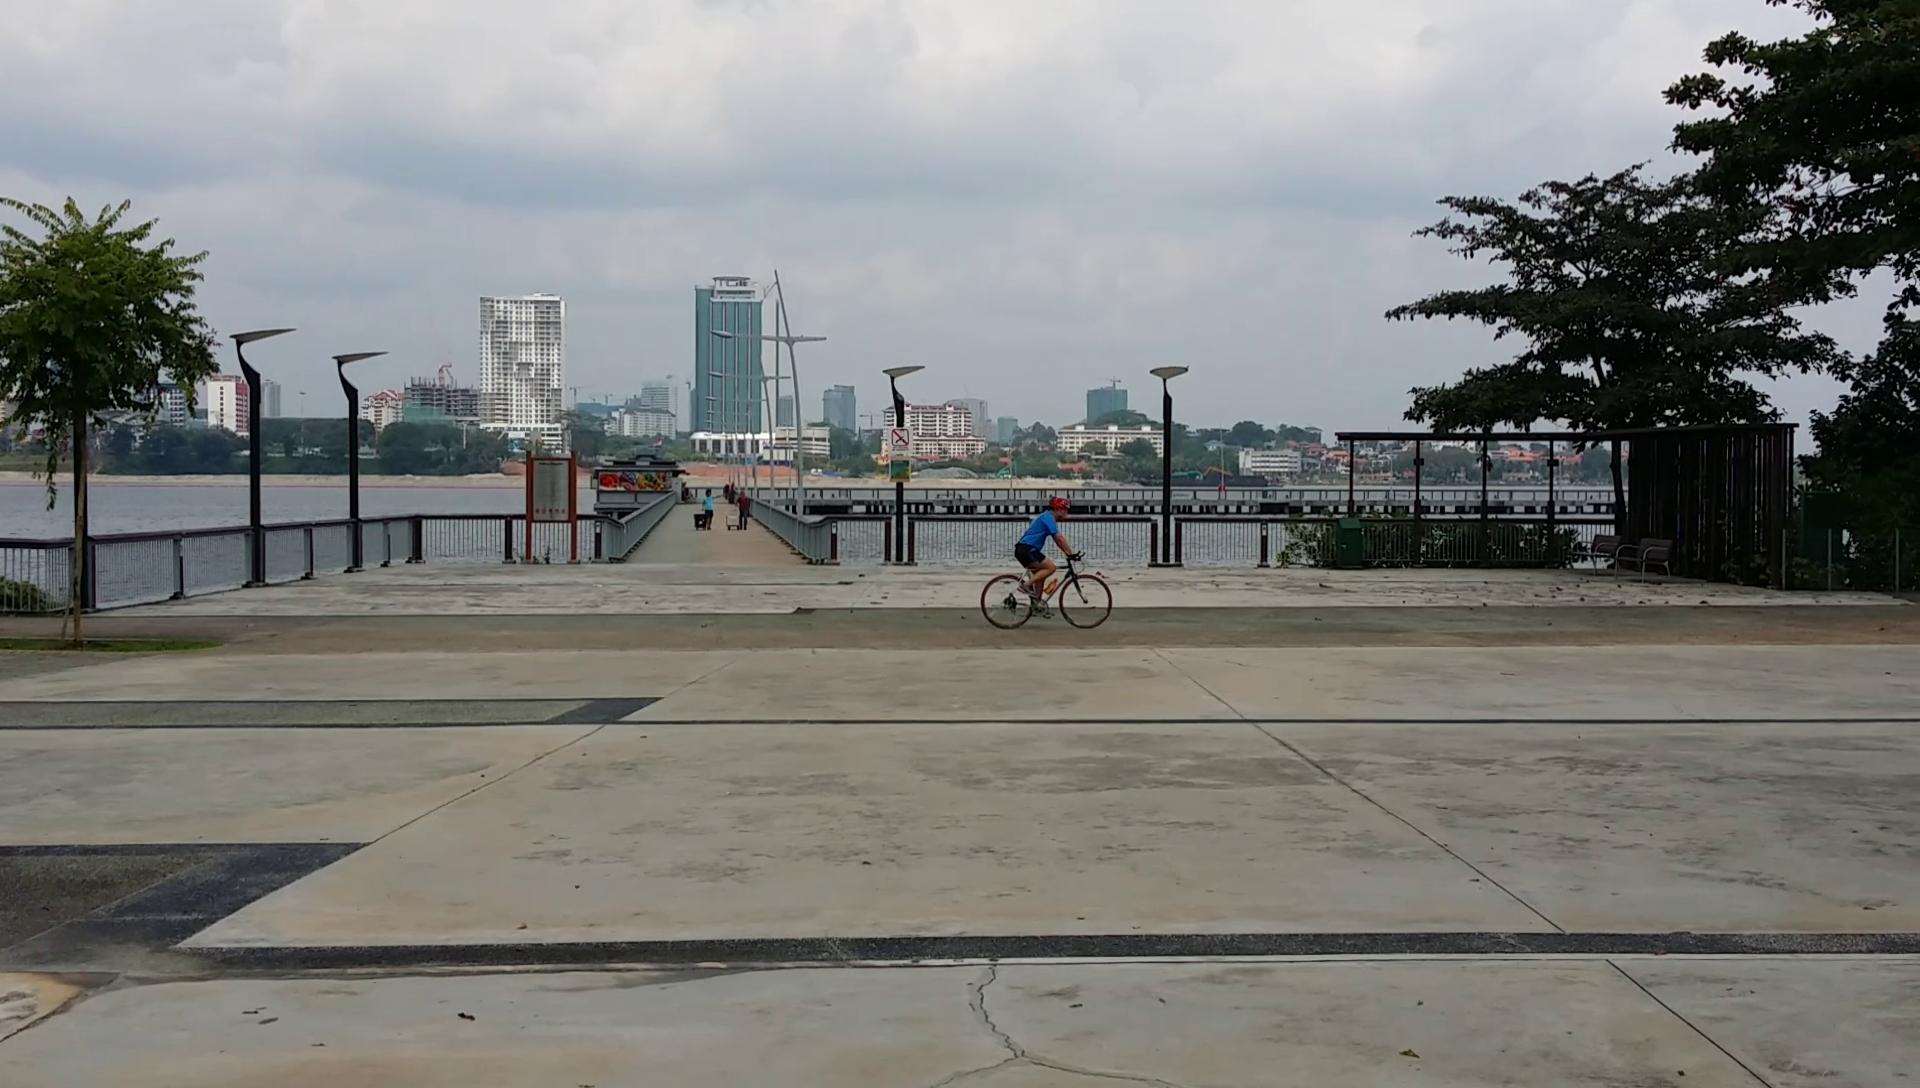
Document Brief: Title: "Tracker Rate of Change Decelerating Bicycles with Model by Evergreen Sec Tan Kim Kia"
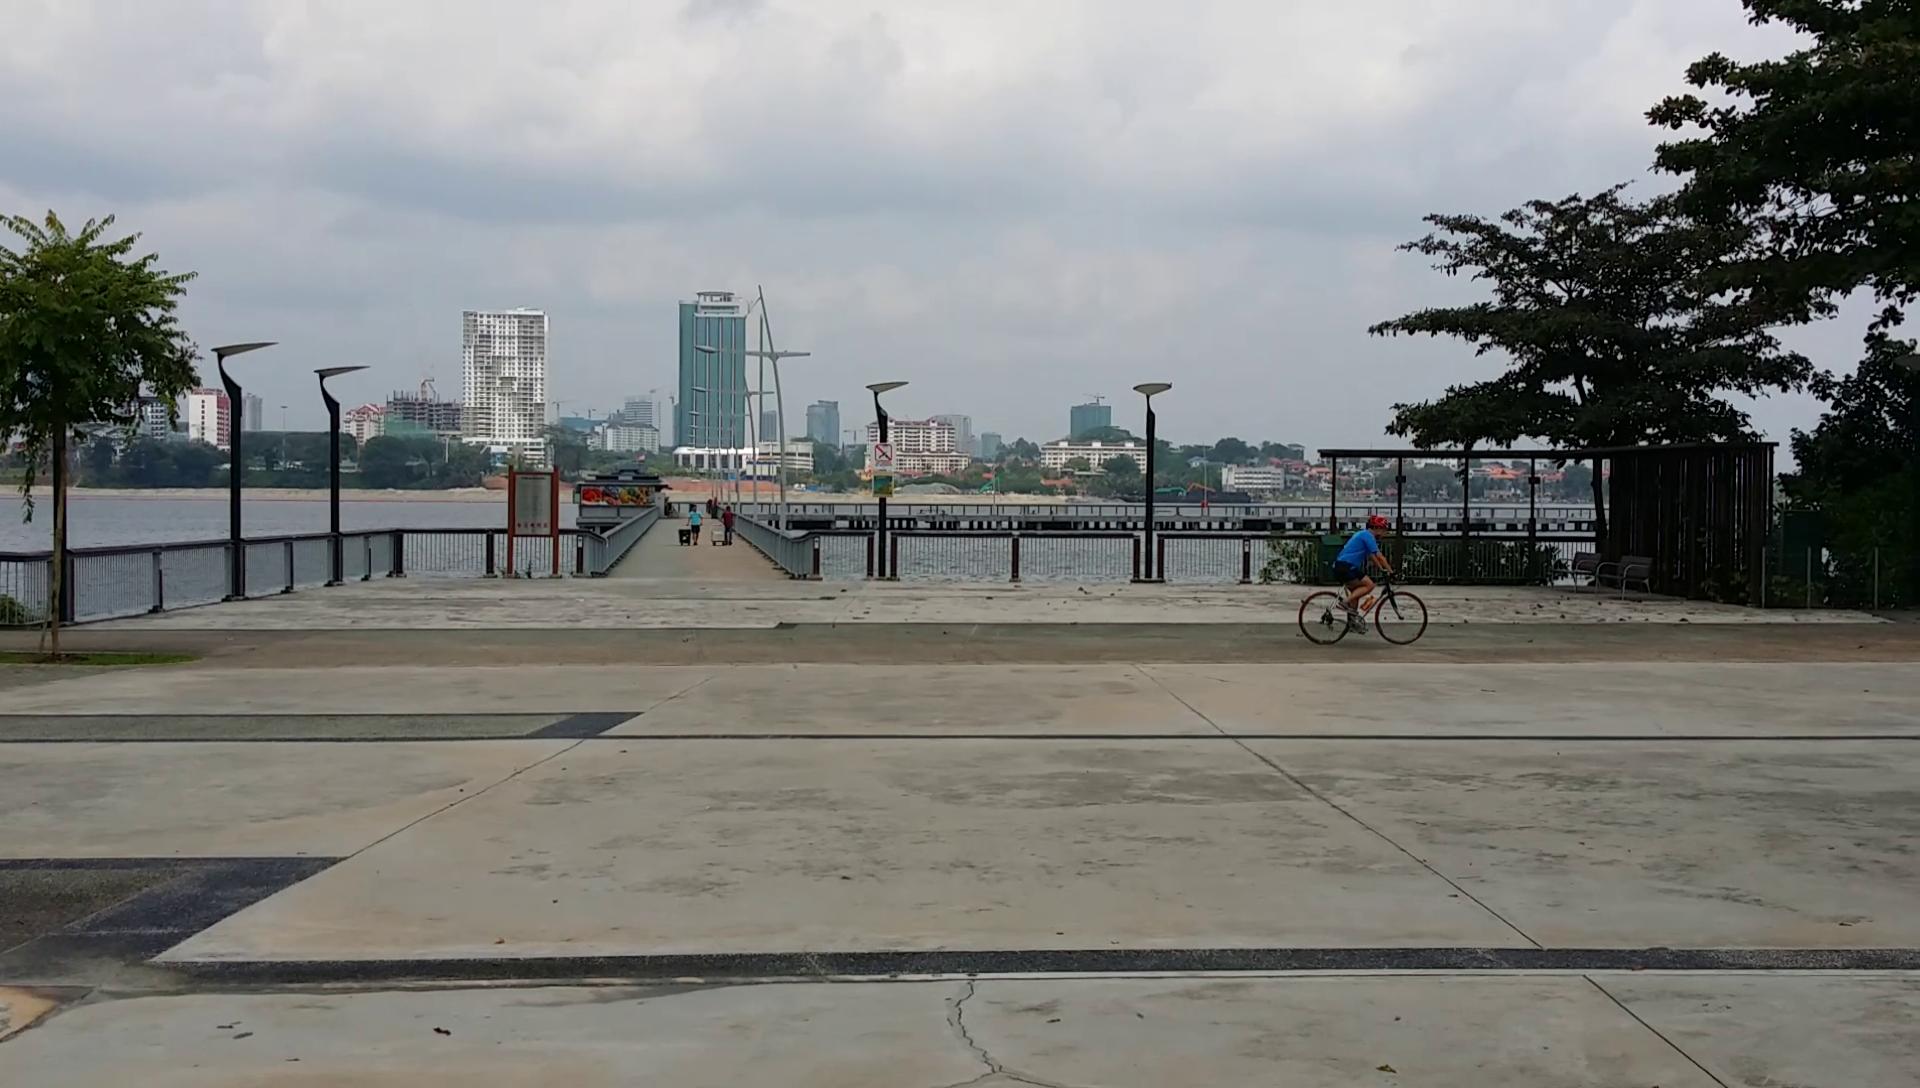
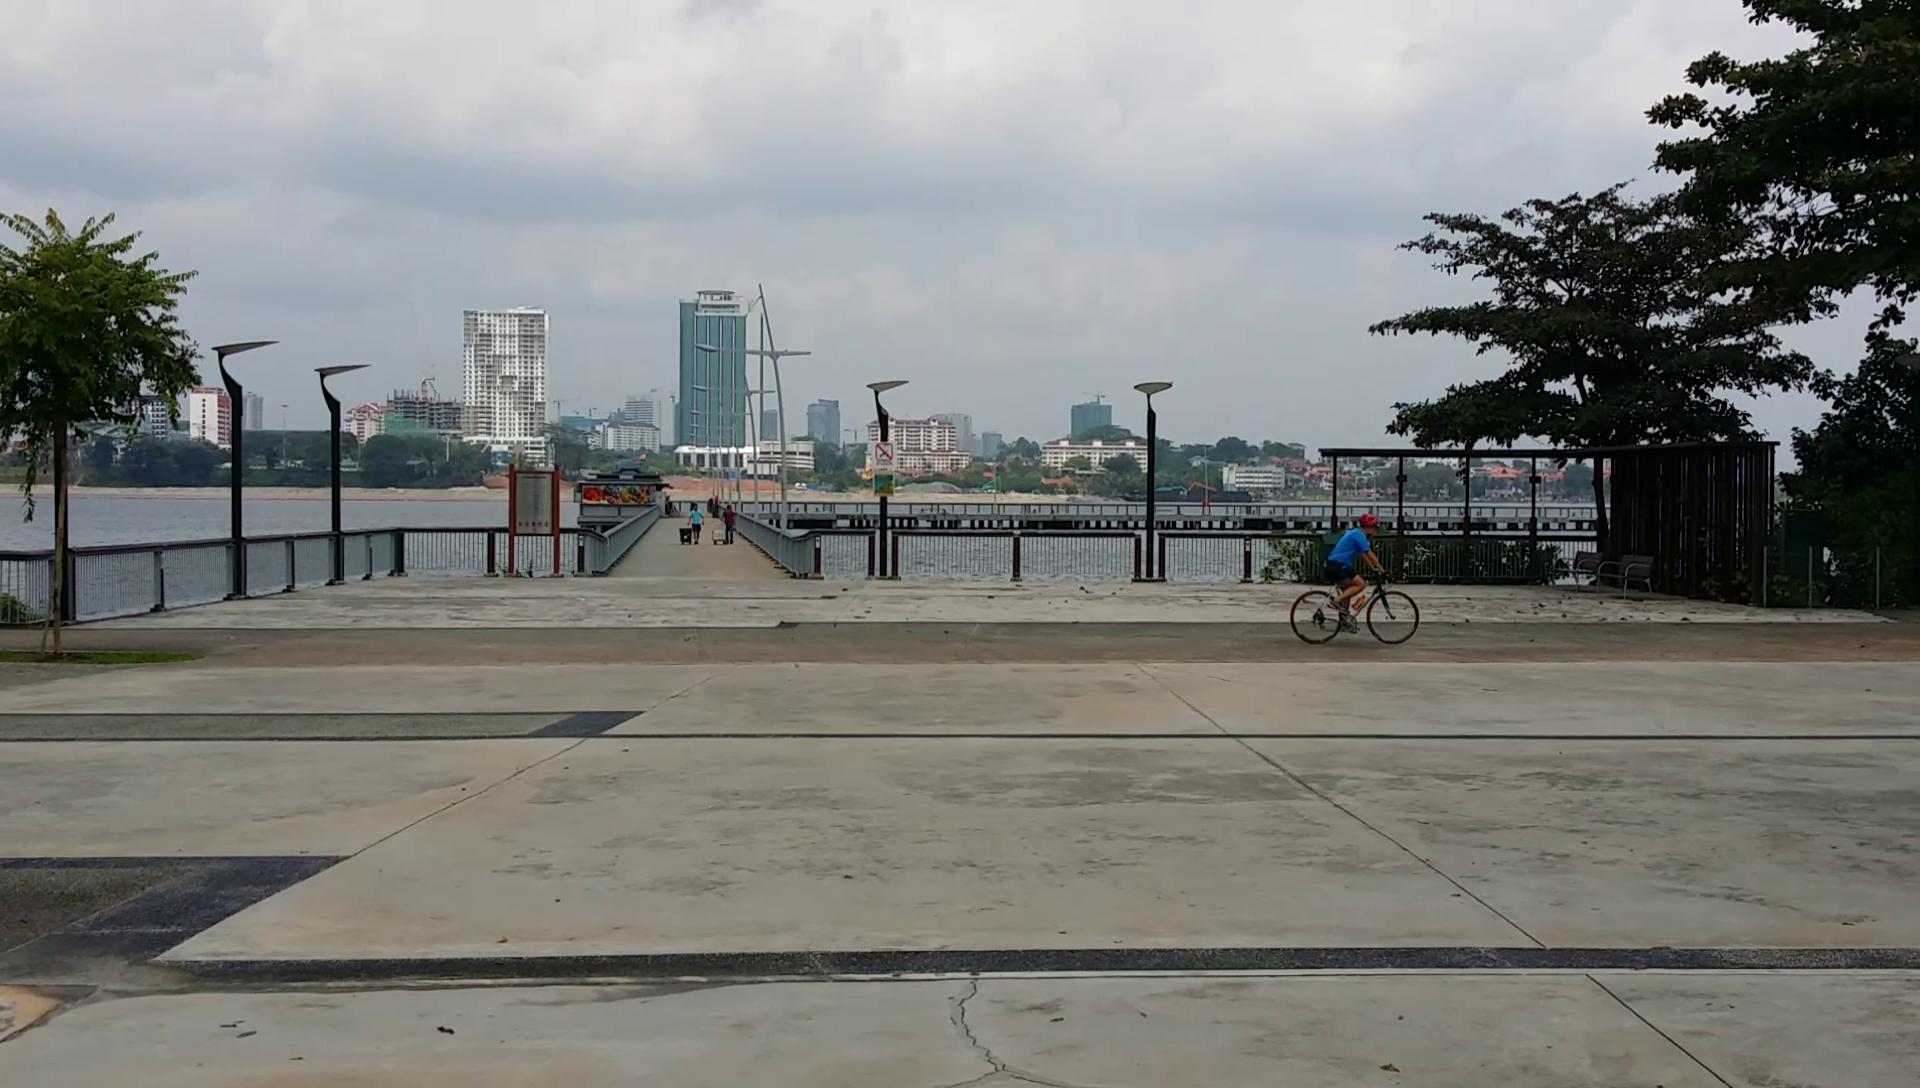
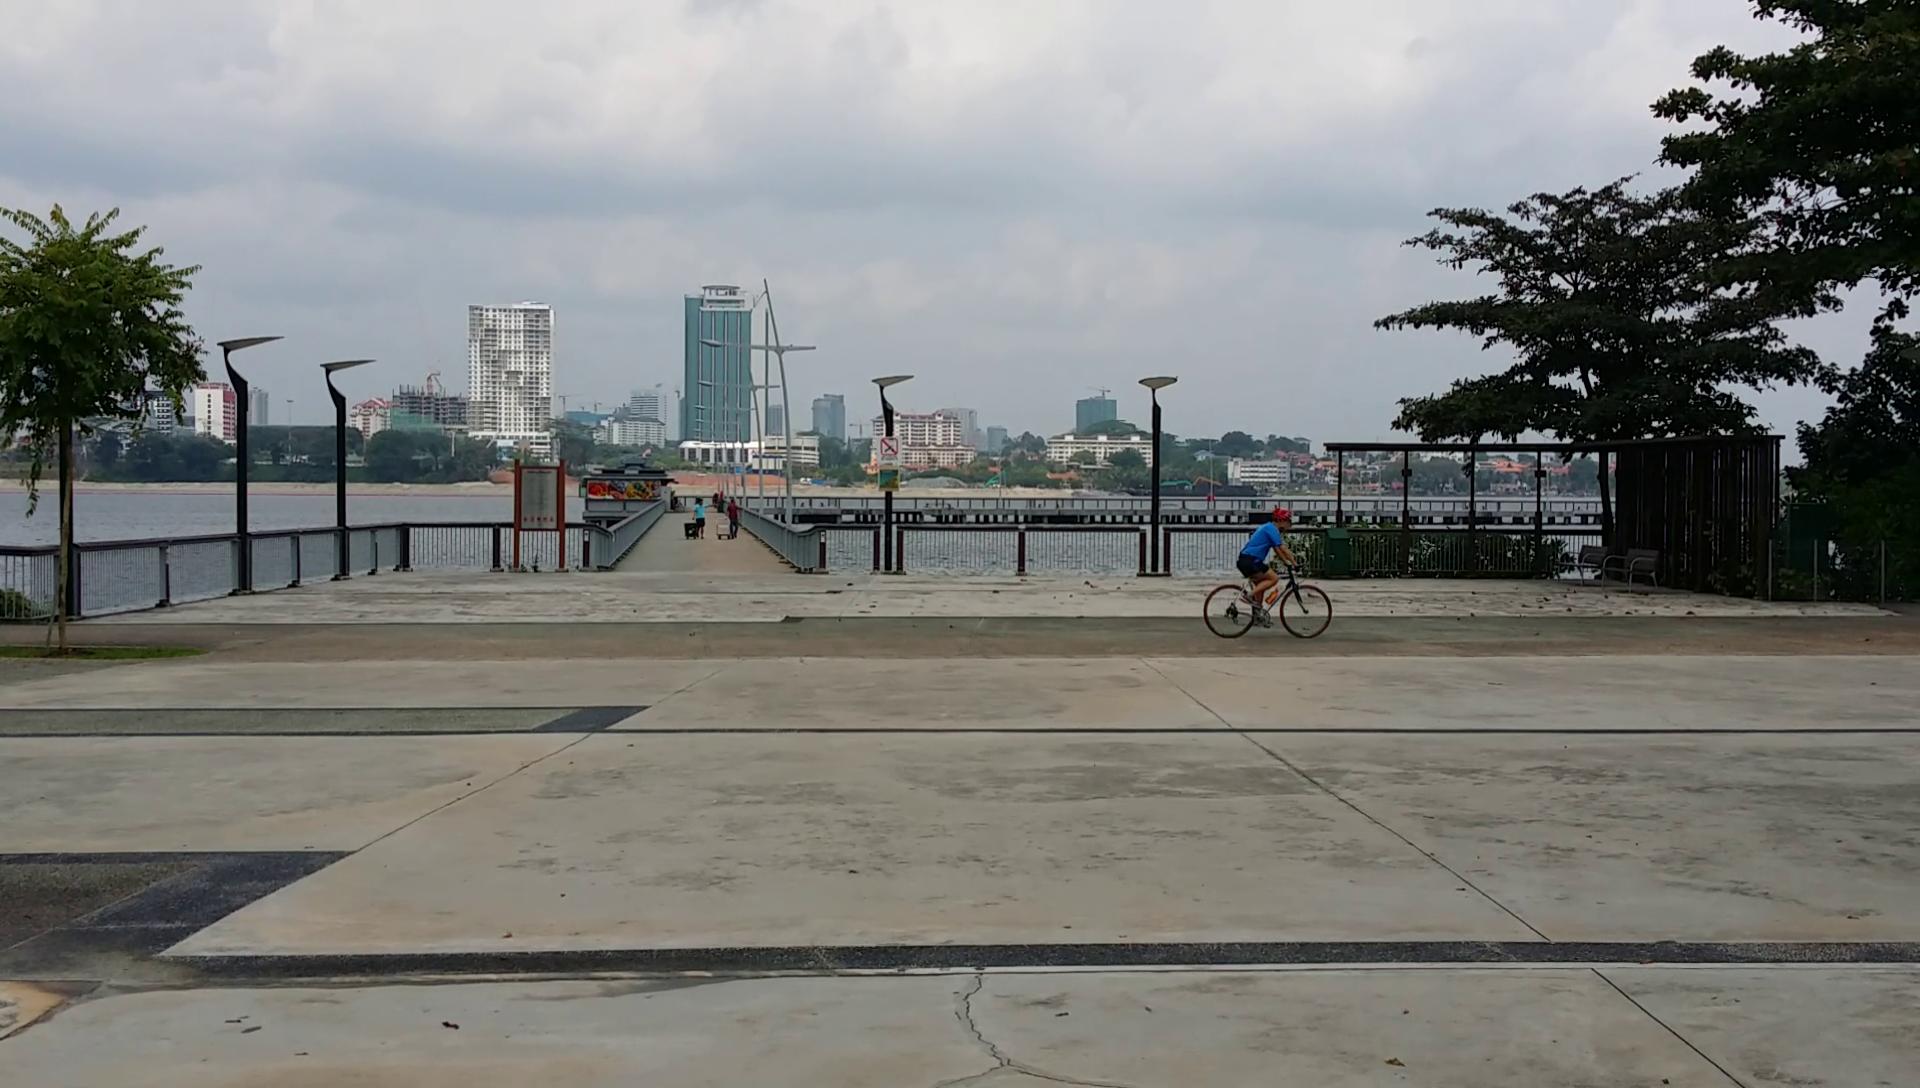
This document investigates the deceleration of bicycles, analyzing the rate of change of velocity and the factors contributing to the reduction in speed. Using a model, the dynamics of deceleration are visualized and understood through graphical and numerical analysis.
Study Guide:
Objective: Examine the deceleration of bicycles to understand the relationship between force, mass, and rate of change of velocity.
Key Concepts:
-
Deceleration:
-
Negative acceleration indicating a reduction in velocity over time.
-
-
Newton’s Second Law of Motion:
-
, where a negative force (braking or resistance) results in deceleration.
-
-
Force Opposing Motion:
-
Braking force, air resistance, and friction contribute to the reduction in speed.
-
-
Velocity-Time Graphs:
-
Useful for analyzing deceleration rates by observing the slope.
-
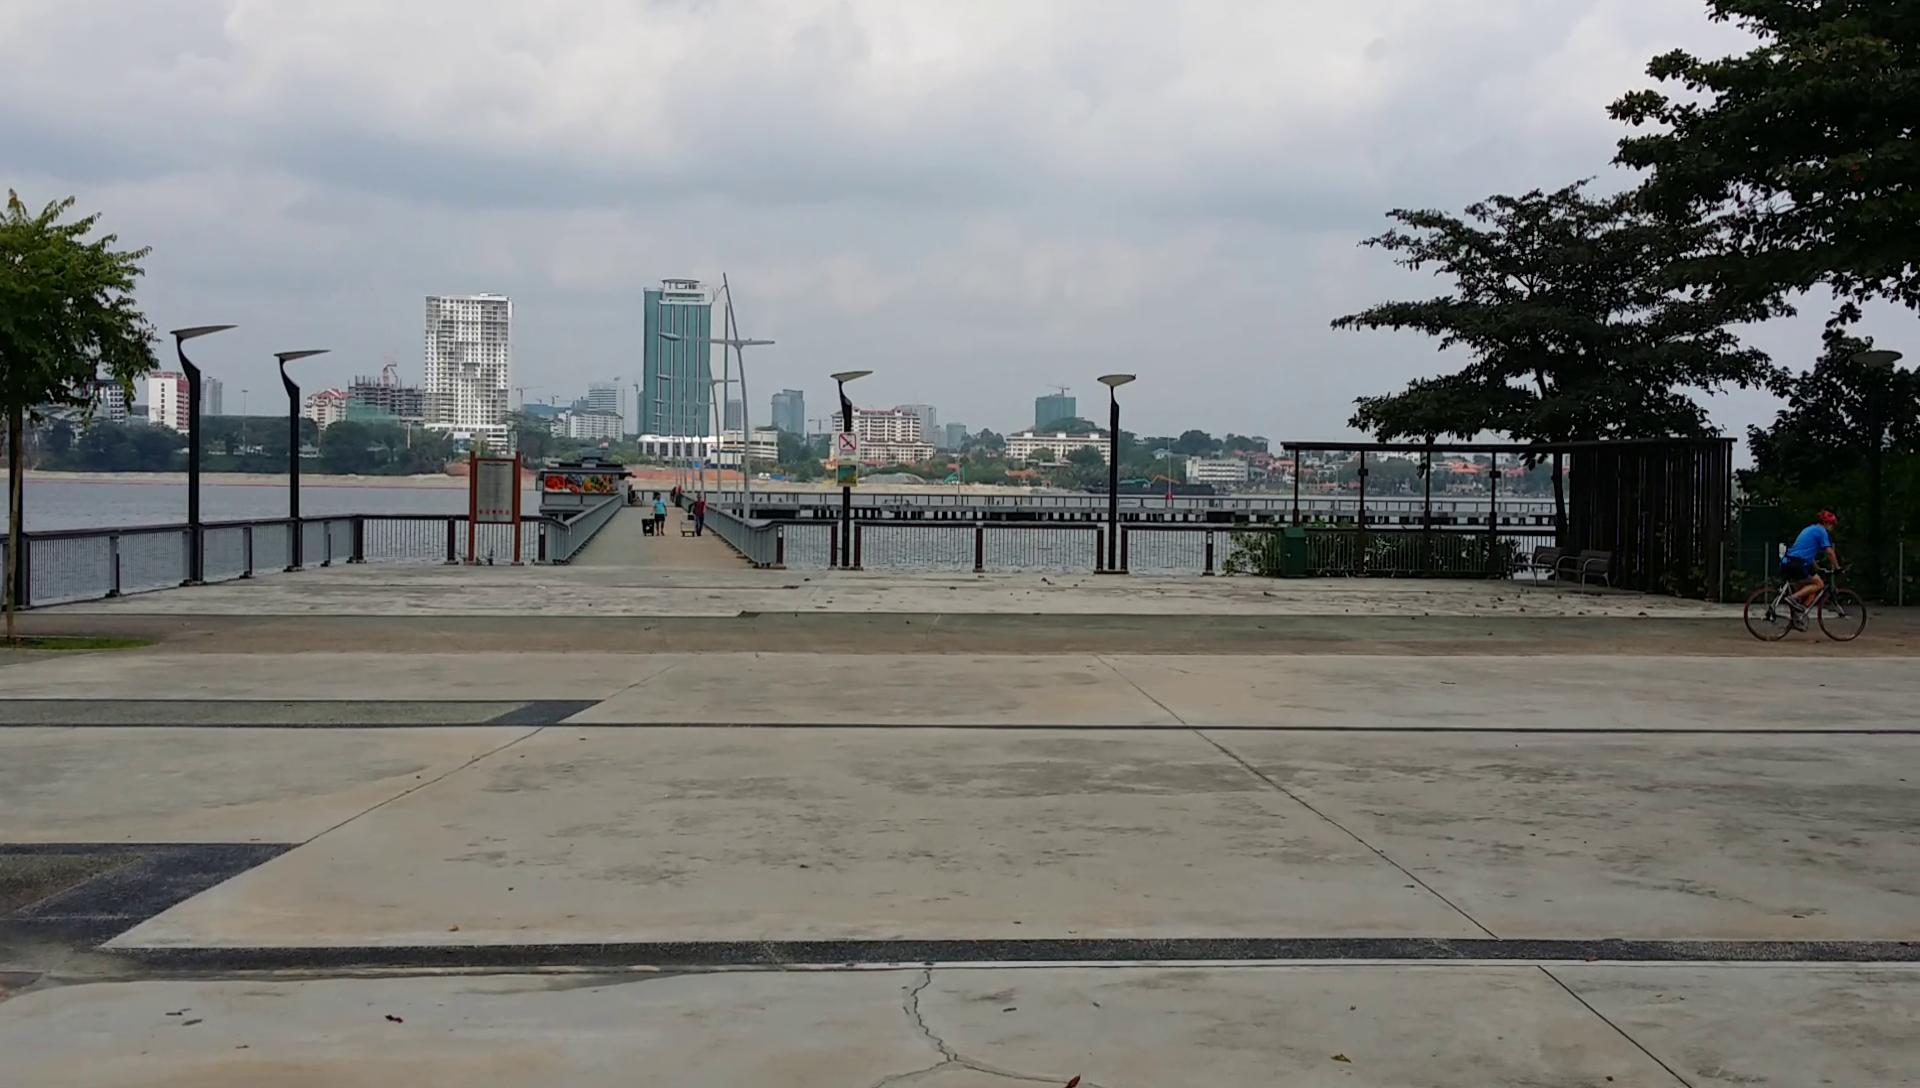
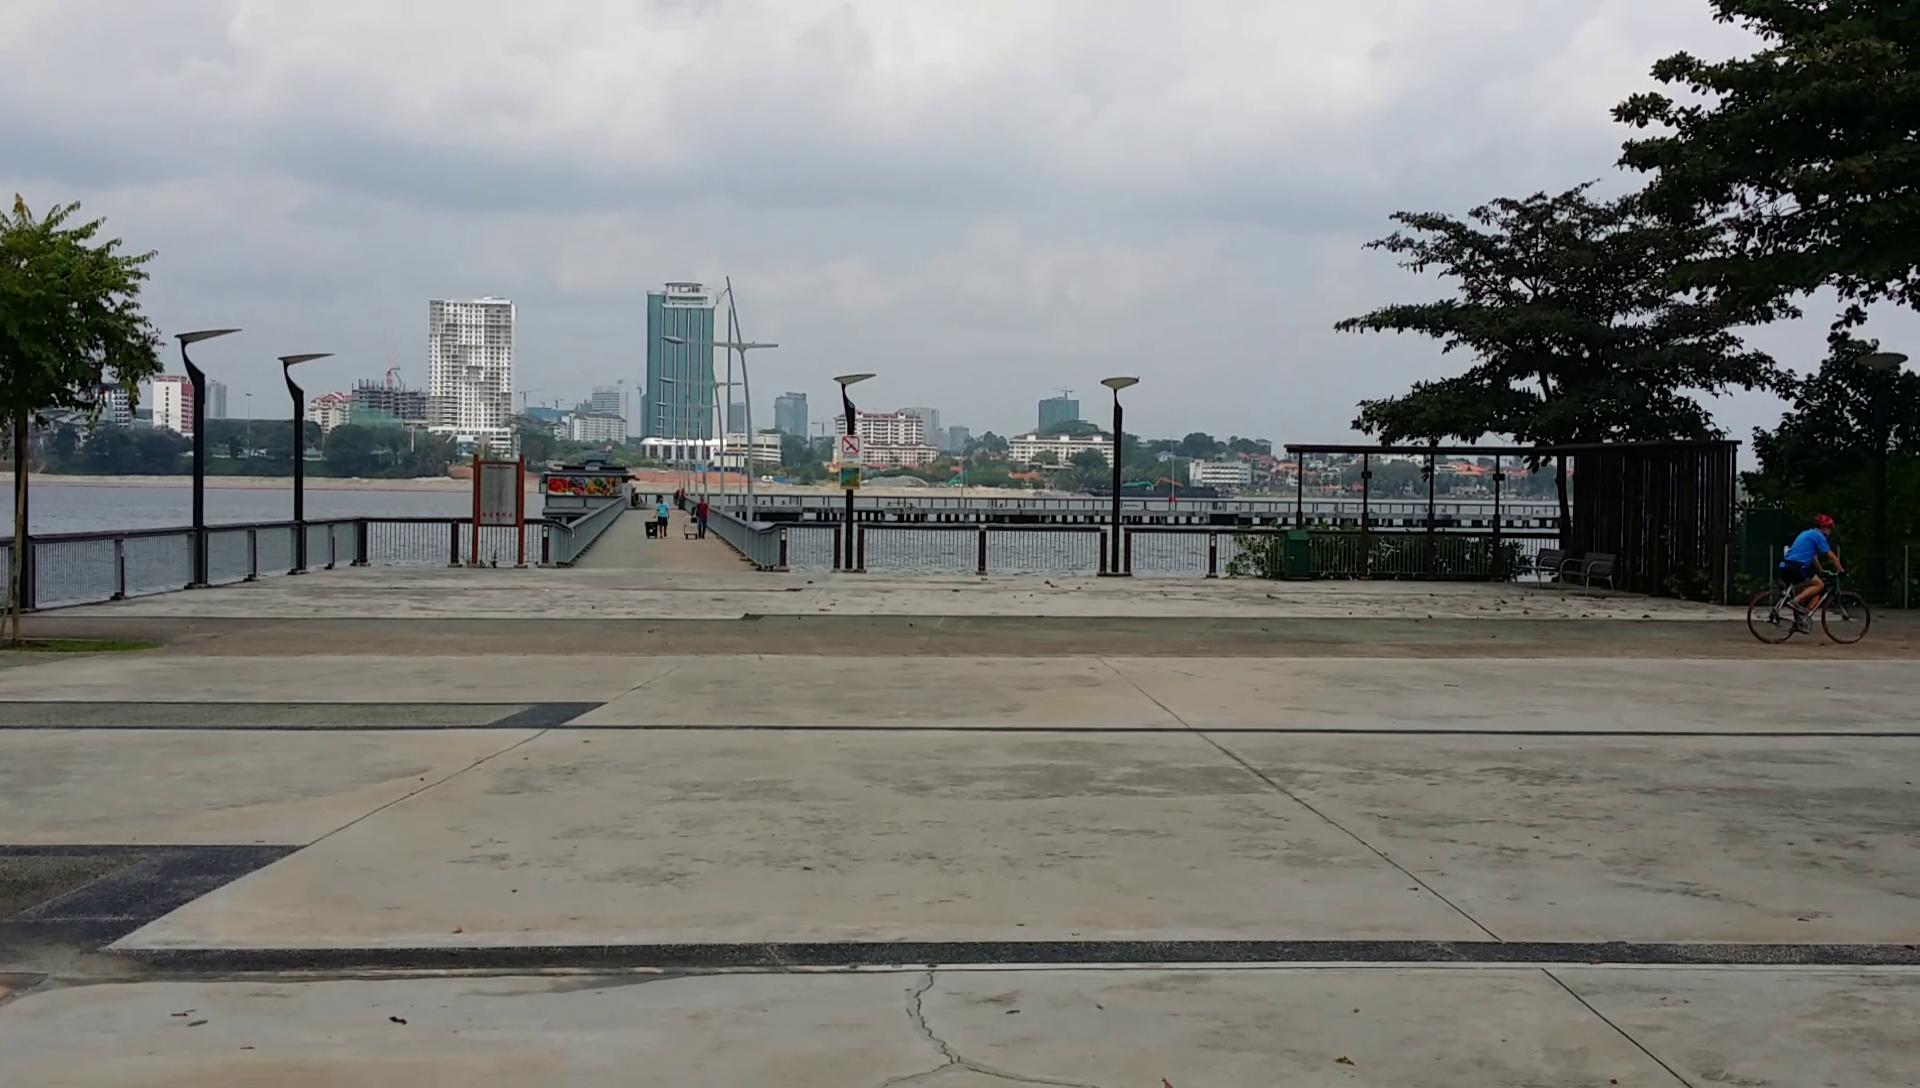
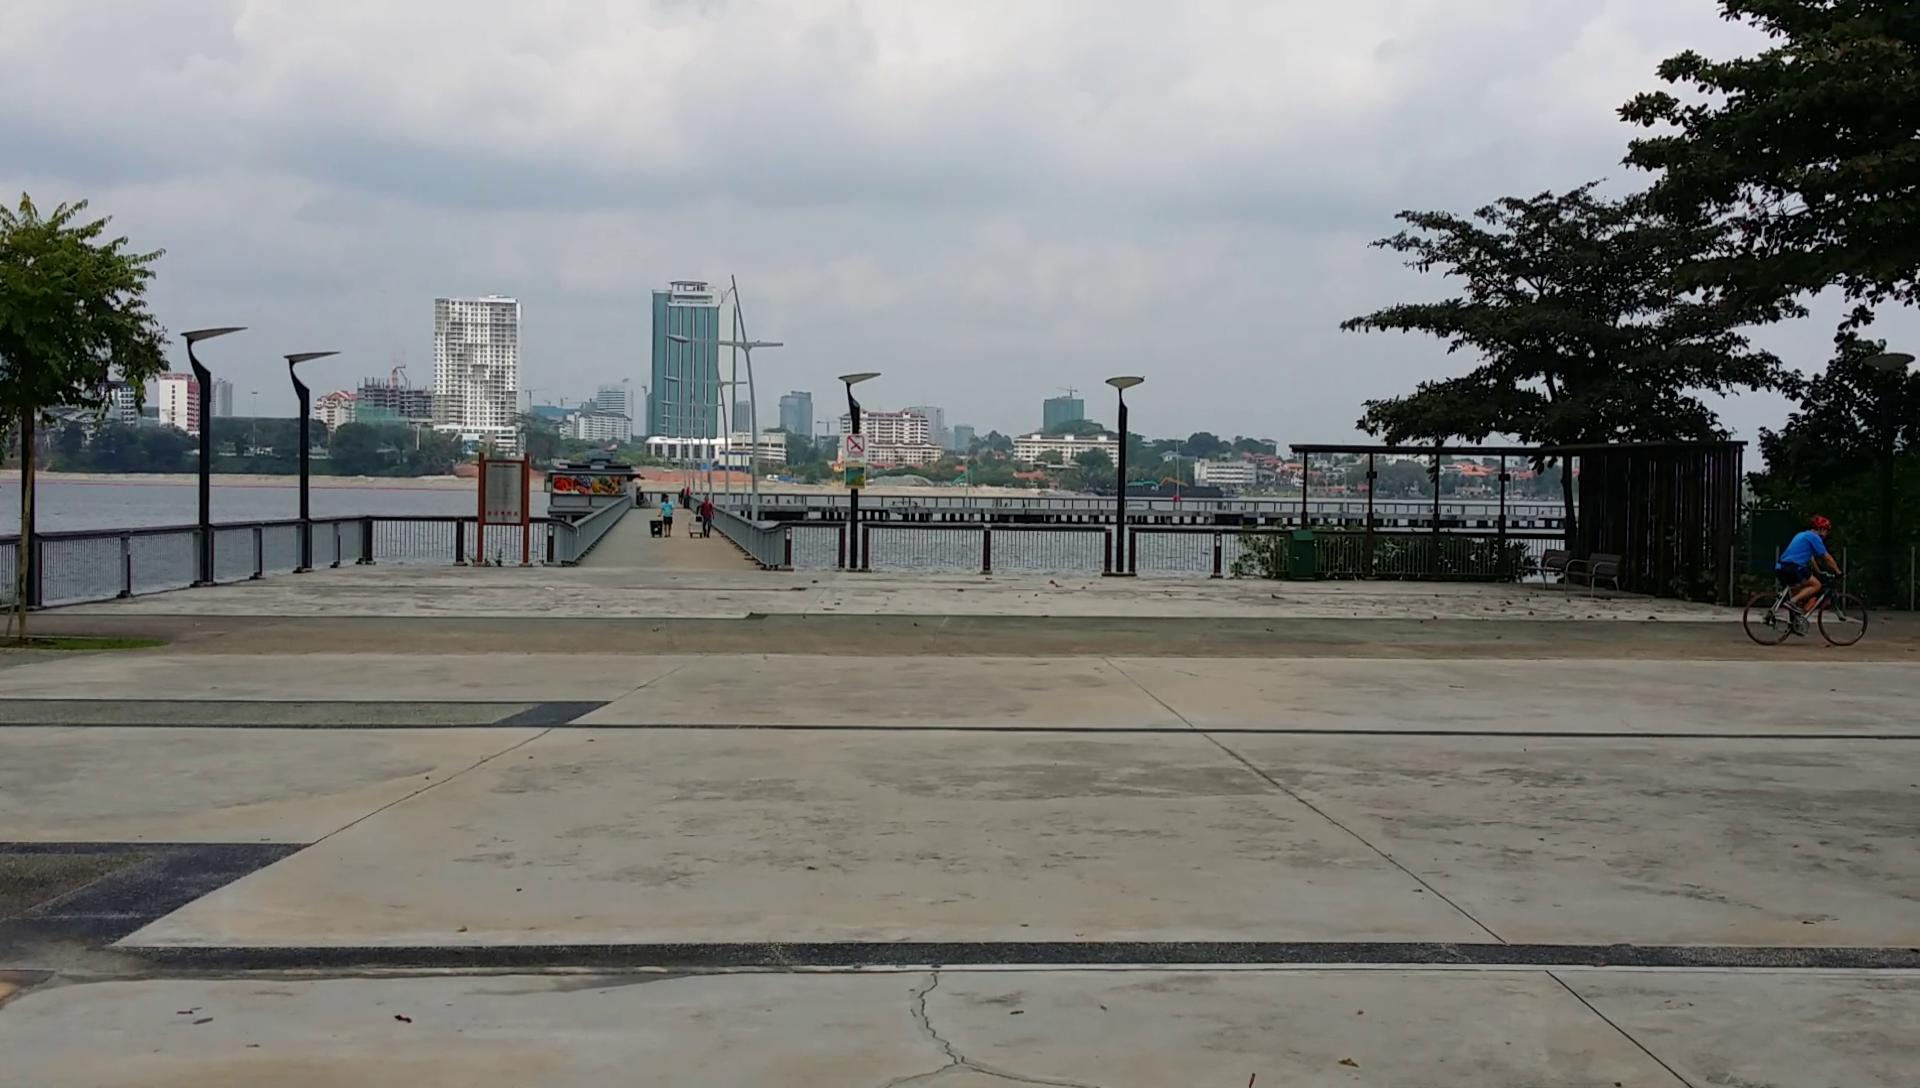
Experiment Overview:
-
Setup: Bicycles are tracked as they decelerate under controlled conditions, such as braking on a flat surface. Motion data is captured using a video tracker or speed sensors.
-
Procedure:
-
Record velocity and time as the bicycles come to a stop.
-
Plot velocity-time graphs to determine deceleration rates.
-
Compare deceleration under different braking forces or surface conditions.
-
-
Observation Points:
-
Slope of the velocity-time graph (indicates the rate of deceleration).
-
Time taken to come to a stop.
-
Questions to Consider:
-
How does braking force affect deceleration?
-
Answer: Greater braking force results in higher deceleration rates, leading to shorter stopping distances.
-
-
What role does surface condition play in deceleration?
-
Answer: Rough or high-friction surfaces enhance deceleration, while smooth or wet surfaces reduce it, increasing stopping distances.
-
-
How is deceleration calculated from velocity-time data?
-
Answer: Deceleration is the slope of the velocity-time graph and is calculated as , where is the change in velocity and is the time interval.
-
Applications:
-
Understanding braking dynamics in vehicles and bicycles.
-
Designing safer braking systems and optimizing stopping distances.
-
Teaching principles of motion and forces in educational settings.
FAQ:
-
What is deceleration? Deceleration is negative acceleration, where an object slows down over time.
-
How is deceleration visualized? By plotting a velocity-time graph; a downward slope represents deceleration.
-
Why does friction aid in stopping? Friction opposes motion and helps convert kinetic energy into heat, reducing velocity.
-
What factors affect stopping distance? Stopping distance is influenced by speed, braking force, mass, and surface condition.
-
Can this analysis apply to other vehicles? Yes, the principles of deceleration are universal and apply to all modes of transportation.
- Details
- Written by Kimkia
- Parent Category: 03 Motion & Forces
- Category: 01 Kinematics
- Hits: 8458